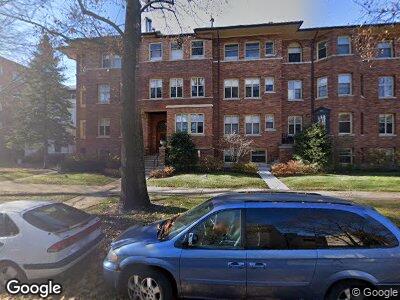
936 Hinman Ave Unit 936N1 Evanston, IL 60202
Southeast Evanston NeighborhoodEstimated Value: $398,075 - $448,000
3
Beds
2
Baths
46,728
Sq Ft
$9/Sq Ft
Est. Value
About This Home
This home is located at 936 Hinman Ave Unit 936N1, Evanston, IL 60202 and is currently estimated at $419,019, approximately $8 per square foot. 936 Hinman Ave Unit 936N1 is a home located in Cook County with nearby schools including Lincoln Elementary School, Washington Elementary School, and Nichols Middle School.
Ownership History
Date
Name
Owned For
Owner Type
Purchase Details
Closed on
Mar 18, 2022
Sold by
Telser-Frere Joanne
Bought by
Joanne Telser-Frere Revocable Trust
Current Estimated Value
Purchase Details
Closed on
Jul 29, 2010
Sold by
Cleveland Barbara L
Bought by
Telser Frere Joanne
Purchase Details
Closed on
Nov 17, 1998
Sold by
Walsh Brendan T and Walsh Karen A
Bought by
Cleveland Barbara L
Home Financials for this Owner
Home Financials are based on the most recent Mortgage that was taken out on this home.
Original Mortgage
$149,000
Interest Rate
6.79%
Mortgage Type
Balloon
Purchase Details
Closed on
Feb 25, 1997
Sold by
First Bank & Trust Company Of Illinois
Bought by
Walsh Brendan T and Walsh Karen A
Home Financials for this Owner
Home Financials are based on the most recent Mortgage that was taken out on this home.
Original Mortgage
$146,400
Interest Rate
6.62%
Create a Home Valuation Report for This Property
The Home Valuation Report is an in-depth analysis detailing your home's value as well as a comparison with similar homes in the area
Home Values in the Area
Average Home Value in this Area
Purchase History
| Date | Buyer | Sale Price | Title Company |
|---|---|---|---|
| Joanne Telser-Frere Revocable Trust | -- | None Listed On Document | |
| Telser Frere Joanne | $237,500 | Cti | |
| Cleveland Barbara L | $209,000 | -- | |
| Walsh Brendan T | $183,000 | -- |
Source: Public Records
Mortgage History
| Date | Status | Borrower | Loan Amount |
|---|---|---|---|
| Previous Owner | Frere Joanne Telser | $62,000 | |
| Previous Owner | Cleveland Barbara L | $100,000 | |
| Previous Owner | Cleveland Barbara L | $149,000 | |
| Previous Owner | Walsh Brendan T | $146,400 |
Source: Public Records
Tax History Compared to Growth
Tax History
| Year | Tax Paid | Tax Assessment Tax Assessment Total Assessment is a certain percentage of the fair market value that is determined by local assessors to be the total taxable value of land and additions on the property. | Land | Improvement |
|---|---|---|---|---|
| 2024 | $5,887 | $31,501 | $2,388 | $29,113 |
| 2023 | $5,887 | $31,501 | $2,388 | $29,113 |
| 2022 | $5,887 | $31,501 | $2,388 | $29,113 |
| 2021 | $5,318 | $26,701 | $1,719 | $24,982 |
| 2020 | $5,529 | $26,701 | $1,719 | $24,982 |
| 2019 | $5,358 | $29,041 | $1,719 | $27,322 |
| 2018 | $4,609 | $20,259 | $1,432 | $18,827 |
| 2017 | $4,505 | $20,259 | $1,432 | $18,827 |
| 2016 | $4,495 | $20,259 | $1,432 | $18,827 |
| 2015 | $4,887 | $20,849 | $1,217 | $19,632 |
| 2014 | $4,855 | $20,849 | $1,217 | $19,632 |
| 2013 | $4,727 | $20,849 | $1,217 | $19,632 |
Source: Public Records
Map
Nearby Homes
- 508 Lee St Unit 3E
- 240 Lee St Unit 3
- 318 Main St Unit 3
- 814 Hinman Ave
- 807 Hinman Ave Unit 3
- 1120 Forest Ave
- 806 Forest Ave Unit 3
- 311 Kedzie St Unit 2
- 311 Kedzie St Unit 3
- 1138 Judson Ave
- 1117 Forest Ave
- 938 Edgemere Ct
- 1122 Sherman Ave
- 711 Custer Ave
- 1124 Sherman Ave
- 1022 Elmwood Ave
- 706 Forest Ave
- 743 Michigan Ave
- 911 Maple Ave Unit 1N
- 1246 Judson Ave
- 936 Hinman Ave Unit 936N3
- 936 Hinman Ave Unit 5041
- 936 Hinman Ave Unit 512S1
- 936 Hinman Ave Unit 5021
- 936 Hinman Ave Unit 936G
- 936 Hinman Ave Unit 936S1
- 936 Hinman Ave Unit 936S2
- 936 Hinman Ave Unit 512N3
- 936 Hinman Ave Unit 936S3
- 936 Hinman Ave Unit 508E1
- 936 Hinman Ave Unit 936N1
- 936 Hinman Ave Unit 3N
- 936 Hinman Ave Unit G
- 936 Hinman Ave Unit 1N
- 936 Hinman Ave Unit 3S
- 931 Hinman Ave Unit 2
- 931 Hinman Ave
- 933 Hinman Ave
- 933 Hinman Ave Unit 2
- 927 Hinman Ave Unit GS