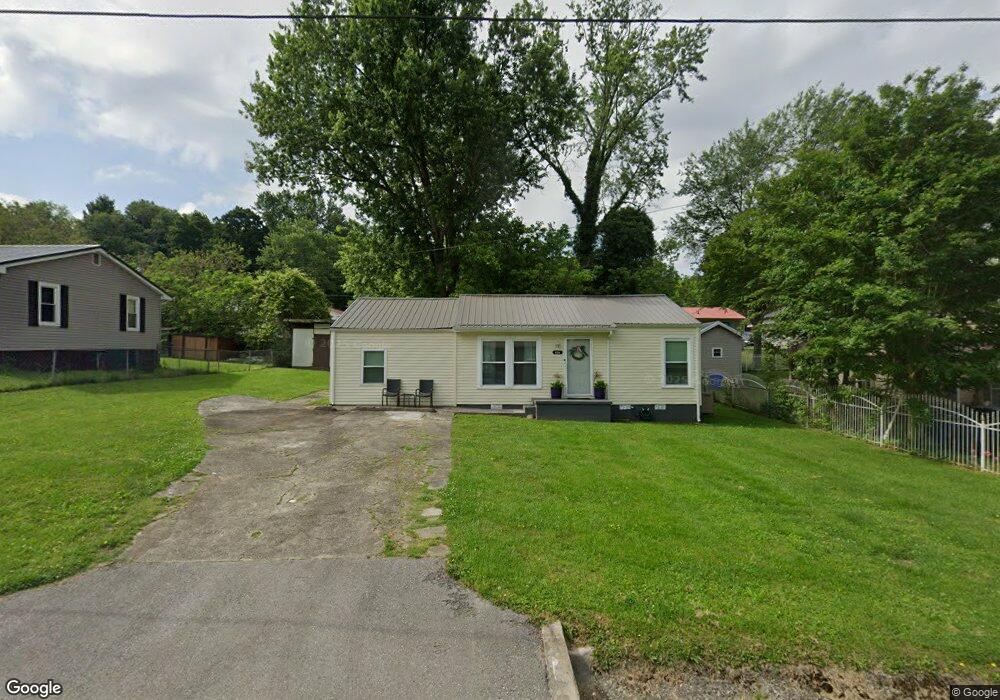
936 Marsh Ave Morristown, TN 37814
Estimated Value: $89,000 - $174,000
--
Bed
2
Baths
938
Sq Ft
$148/Sq Ft
Est. Value
About This Home
This home is located at 936 Marsh Ave, Morristown, TN 37814 and is currently estimated at $138,999, approximately $148 per square foot. 936 Marsh Ave is a home located in Hamblen County with nearby schools including Fairview-Marguerite Elementary School, Meadowview Middle School, and Morristown East High School.
Ownership History
Date
Name
Owned For
Owner Type
Purchase Details
Closed on
Aug 12, 2003
Sold by
Bullion George M
Bought by
Swagerty Michael T
Current Estimated Value
Home Financials for this Owner
Home Financials are based on the most recent Mortgage that was taken out on this home.
Original Mortgage
$51,592
Outstanding Balance
$22,554
Interest Rate
5.52%
Estimated Equity
$116,446
Purchase Details
Closed on
Nov 25, 2002
Sold by
Suntrust Bank
Bought by
Bullion George M
Purchase Details
Closed on
Sep 20, 2002
Sold by
Tillis Charles B
Bought by
Suntrust Bank
Purchase Details
Closed on
May 24, 1997
Sold by
Collins Polly A
Bought by
Charles Tillis
Home Financials for this Owner
Home Financials are based on the most recent Mortgage that was taken out on this home.
Original Mortgage
$46,075
Interest Rate
8.13%
Purchase Details
Closed on
Jan 2, 1985
Bought by
Collins Polly A
Create a Home Valuation Report for This Property
The Home Valuation Report is an in-depth analysis detailing your home's value as well as a comparison with similar homes in the area
Home Values in the Area
Average Home Value in this Area
Purchase History
| Date | Buyer | Sale Price | Title Company |
|---|---|---|---|
| Swagerty Michael T | $52,000 | -- | |
| Bullion George M | $25,800 | -- | |
| Suntrust Bank | $48,847 | -- | |
| Charles Tillis | $47,500 | -- | |
| Collins Polly A | $26,000 | -- |
Source: Public Records
Mortgage History
| Date | Status | Borrower | Loan Amount |
|---|---|---|---|
| Open | Collins Polly A | $51,592 | |
| Previous Owner | Collins Polly A | $46,075 |
Source: Public Records
Tax History Compared to Growth
Tax History
| Year | Tax Paid | Tax Assessment Tax Assessment Total Assessment is a certain percentage of the fair market value that is determined by local assessors to be the total taxable value of land and additions on the property. | Land | Improvement |
|---|---|---|---|---|
| 2024 | $278 | $15,775 | $2,275 | $13,500 |
| 2023 | $278 | $15,775 | $0 | $0 |
| 2022 | $499 | $15,775 | $2,275 | $13,500 |
| 2021 | $499 | $15,775 | $2,275 | $13,500 |
| 2020 | $498 | $15,775 | $2,275 | $13,500 |
| 2019 | $469 | $13,800 | $2,125 | $11,675 |
| 2018 | $435 | $13,800 | $2,125 | $11,675 |
| 2017 | $428 | $13,800 | $2,125 | $11,675 |
| 2016 | $409 | $13,800 | $2,125 | $11,675 |
| 2015 | $380 | $13,800 | $2,125 | $11,675 |
| 2014 | -- | $13,800 | $2,125 | $11,675 |
| 2013 | -- | $14,250 | $0 | $0 |
Source: Public Records
Map
Nearby Homes
- 1420 Buffalo Trail
- 1215 Shields Ferry Rd
- 637 Carriger St
- 000 Devault St
- 1542 Shields Ferry Rd
- 1562 Shields Ferry Rd
- 1449 N Easley Ct
- 1101 Sherwood Dr
- 1324 Davis St
- 305 Branner St
- 2358 Stream View Ln
- 602 Hilltop Dr
- 1323 Goodson Ave
- 311 E 4th St N
- 215 E 5th St N
- 400 E 4th St N
- 721 E 1st North St
- 1126 E 2nd St N
- 721 E 1st St N
- 551 Callaway Dr