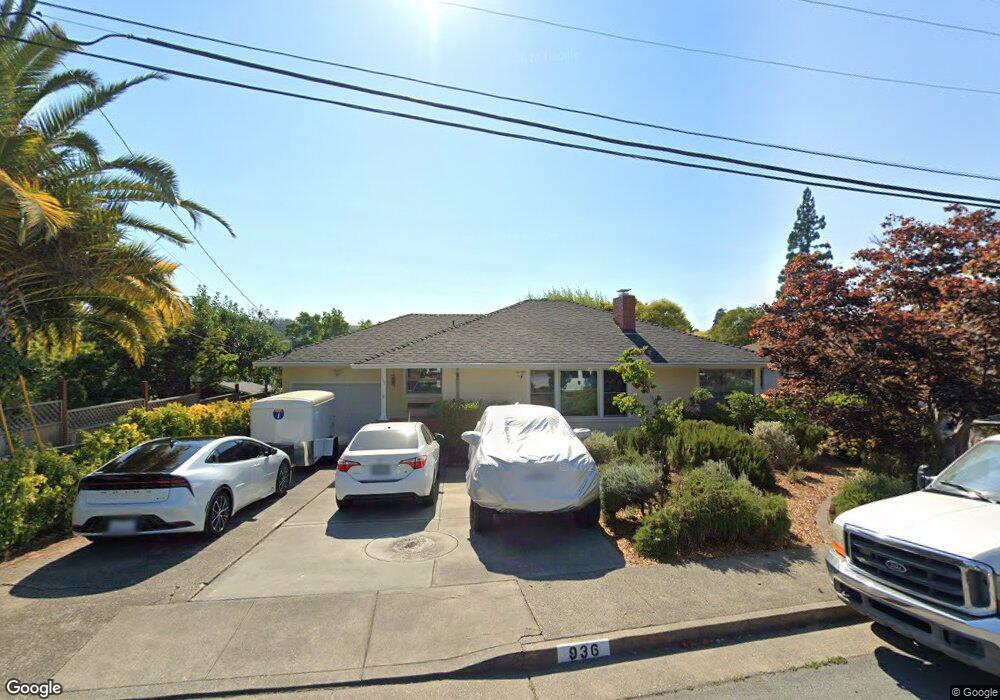
936 Middlefield Dr Petaluma, CA 94952
Western Petaluma NeighborhoodEstimated Value: $832,777 - $975,000
3
Beds
1
Bath
1,723
Sq Ft
$525/Sq Ft
Est. Value
About This Home
This home is located at 936 Middlefield Dr, Petaluma, CA 94952 and is currently estimated at $904,194, approximately $524 per square foot. 936 Middlefield Dr is a home located in Sonoma County with nearby schools including Grant Elementary School, Petaluma Junior High School, and Petaluma High School.
Ownership History
Date
Name
Owned For
Owner Type
Purchase Details
Closed on
Dec 10, 2001
Sold by
Deen Michael J and Deen Michael Justin
Bought by
Deen Michael J and Deen Lori P
Current Estimated Value
Home Financials for this Owner
Home Financials are based on the most recent Mortgage that was taken out on this home.
Original Mortgage
$233,500
Interest Rate
6.57%
Purchase Details
Closed on
Dec 19, 1997
Sold by
Deen Dennis F and Deen Charlene M
Bought by
Deen Michael Justin
Home Financials for this Owner
Home Financials are based on the most recent Mortgage that was taken out on this home.
Original Mortgage
$208,000
Interest Rate
7.22%
Purchase Details
Closed on
Sep 23, 1996
Sold by
Segurson Frank A
Bought by
Deen Michael Justin and Deen Dennis F
Home Financials for this Owner
Home Financials are based on the most recent Mortgage that was taken out on this home.
Original Mortgage
$206,077
Interest Rate
7.87%
Mortgage Type
Balloon
Create a Home Valuation Report for This Property
The Home Valuation Report is an in-depth analysis detailing your home's value as well as a comparison with similar homes in the area
Home Values in the Area
Average Home Value in this Area
Purchase History
| Date | Buyer | Sale Price | Title Company |
|---|---|---|---|
| Deen Michael J | -- | Chicago Title Co | |
| Deen Michael Justin | $1,000 | North American Title Co | |
| Deen Michael Justin | $229,000 | Sonoma Title Guaranty Compan |
Source: Public Records
Mortgage History
| Date | Status | Borrower | Loan Amount |
|---|---|---|---|
| Closed | Deen Michael J | $233,500 | |
| Closed | Deen Michael Justin | $208,000 | |
| Closed | Deen Michael Justin | $206,077 |
Source: Public Records
Tax History Compared to Growth
Tax History
| Year | Tax Paid | Tax Assessment Tax Assessment Total Assessment is a certain percentage of the fair market value that is determined by local assessors to be the total taxable value of land and additions on the property. | Land | Improvement |
|---|---|---|---|---|
| 2025 | $4,002 | $365,640 | $191,601 | $174,039 |
| 2024 | $4,002 | $358,472 | $187,845 | $170,627 |
| 2023 | $4,002 | $351,444 | $184,162 | $167,282 |
| 2022 | $3,833 | $344,553 | $180,551 | $164,002 |
| 2021 | $3,761 | $337,798 | $177,011 | $160,787 |
| 2020 | $3,792 | $334,335 | $175,196 | $159,139 |
| 2019 | $3,745 | $327,780 | $171,761 | $156,019 |
| 2018 | $3,729 | $321,354 | $168,394 | $152,960 |
| 2017 | $3,652 | $315,054 | $165,093 | $149,961 |
| 2016 | $3,560 | $308,877 | $161,856 | $147,021 |
| 2015 | $3,511 | $304,238 | $159,425 | $144,813 |
| 2014 | $3,493 | $298,280 | $156,303 | $141,977 |
Source: Public Records
Map
Nearby Homes
- 9 Arlene Ct
- 45 Augusta Cir
- 4 George Terrace
- 5 Troon Terrace
- 218 Jacquelyn Ln
- 244 Mcnear Cir
- 21 Branching Way
- 1028 Addison Cir
- 221 Preston Ct
- 143 Mcnear Cir
- 1170 I St
- 15 Kingswood Dr
- 3 Lapis Ct
- 720 Petaluma Blvd S Unit 39
- 720 Petaluma Blvd S Unit 30
- 304 Parkview Ct
- 22 Oak Knoll Ct
- Residence 12 Plan at Aspect
- 811 D St
- 853 D St
- 932 Middlefield Dr
- 1029 Mcnear Ave
- 1025 Mcnear Ave
- 32 Colinda Dr
- 3 Jensen Dr
- 1 Jensen Dr
- 934 Middlefield Dr
- 1021 Mcnear Ave
- 925 Middlefield Dr
- 28 Colinda Dr
- 1033 Mcnear Ave
- 924 Middlefield Dr
- 1015 Mcnear Ave
- 24 Colinda Dr
- 1037 Mcnear Ave
- 33 Colinda Dr
- 1004 Country Club Dr
- 1020 Mcnear Ave
- 917 Middlefield Dr
- 920 Middlefield Dr