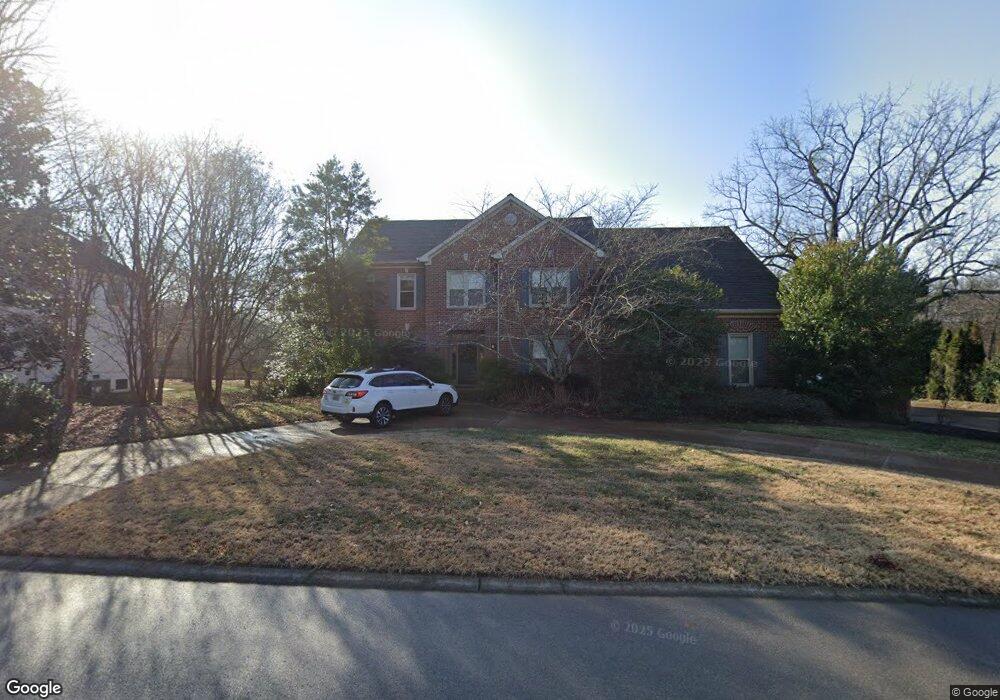
9367 Ansley Ln Brentwood, TN 37027
Estimated Value: $1,121,972 - $1,260,000
--
Bed
4
Baths
3,272
Sq Ft
$358/Sq Ft
Est. Value
About This Home
This home is located at 9367 Ansley Ln, Brentwood, TN 37027 and is currently estimated at $1,172,743, approximately $358 per square foot. 9367 Ansley Ln is a home located in Williamson County with nearby schools including Kenrose Elementary School, Woodland Middle School, and Ravenwood High School.
Ownership History
Date
Name
Owned For
Owner Type
Purchase Details
Closed on
Jul 30, 2004
Sold by
Sirva Relocation Llc Cleveland
Bought by
Starmer John and Starmer Lisa
Current Estimated Value
Home Financials for this Owner
Home Financials are based on the most recent Mortgage that was taken out on this home.
Original Mortgage
$280,000
Interest Rate
5.96%
Mortgage Type
Purchase Money Mortgage
Purchase Details
Closed on
Jul 26, 2002
Sold by
Rossrucker Keith and Rossrucker Jill
Bought by
Wielgosz Karol and Wielgosz Mary A
Home Financials for this Owner
Home Financials are based on the most recent Mortgage that was taken out on this home.
Original Mortgage
$180,000
Interest Rate
6.52%
Purchase Details
Closed on
Dec 29, 1995
Sold by
Radnor Homes Inc
Bought by
Keith Rossrucker
Create a Home Valuation Report for This Property
The Home Valuation Report is an in-depth analysis detailing your home's value as well as a comparison with similar homes in the area
Home Values in the Area
Average Home Value in this Area
Purchase History
| Date | Buyer | Sale Price | Title Company |
|---|---|---|---|
| Starmer John | $350,000 | Elite Title Company | |
| Sirva Relocation Llc | $350,000 | -- | |
| Wielgosz Karol | $307,000 | Rudy Title & Escrow Llc | |
| Keith Rossrucker | $259,390 | -- |
Source: Public Records
Mortgage History
| Date | Status | Borrower | Loan Amount |
|---|---|---|---|
| Closed | Starmer John | $280,000 | |
| Previous Owner | Wielgosz Karol | $180,000 |
Source: Public Records
Tax History Compared to Growth
Tax History
| Year | Tax Paid | Tax Assessment Tax Assessment Total Assessment is a certain percentage of the fair market value that is determined by local assessors to be the total taxable value of land and additions on the property. | Land | Improvement |
|---|---|---|---|---|
| 2025 | $3,202 | $274,650 | $87,500 | $187,150 |
| 2024 | $3,202 | $147,550 | $35,000 | $112,550 |
| 2023 | $3,202 | $147,550 | $35,000 | $112,550 |
| 2022 | $3,202 | $147,550 | $35,000 | $112,550 |
| 2021 | $3,202 | $147,550 | $35,000 | $112,550 |
| 2020 | $3,244 | $125,700 | $32,500 | $93,200 |
| 2019 | $3,244 | $125,700 | $32,500 | $93,200 |
| 2018 | $3,156 | $125,700 | $32,500 | $93,200 |
| 2017 | $3,130 | $125,700 | $32,500 | $93,200 |
| 2016 | $3,093 | $125,700 | $32,500 | $93,200 |
| 2015 | -- | $106,075 | $30,000 | $76,075 |
| 2014 | $467 | $106,075 | $30,000 | $76,075 |
Source: Public Records
Map
Nearby Homes
- 1698 Autumn Place
- 9289 Fordham Dr
- 9431 Highwood Hill Rd
- 9454 Chaucers Ct
- 1761 Charity Dr
- 1585 Fawn Creek Ct
- 1523 Tellcroft Dr
- 0 Dartmouth Dr Unit 24506429
- 0 Dartmouth Dr Unit RTC2974335
- 0 Dartmouth Dr Unit RTC2974334
- 0 Dartmouth Dr Unit RTC2974333
- 1413 New Haven Dr
- 9413 Lost Hollow Ct
- 1562 Timber Ridge Dr
- 1740 Forsyth Park Dr
- 9316 Edenwilde Dr
- 9164 Demery Ct
- 1800 Grey Pointe Dr
- 9331 Joslin Ct
- 9493 Grand Haven Dr
- 9369 Ansley Ln
- 9366 Ansley Ln
- 9368 Ansley Ln
- 9371 Ansley Ln
- 9363 Ansley Ln
- 9364 Ansley Ln
- 1687 Brightway Place
- 9362 Ansley Ln
- 9361 Ansley Ln
- 1685 Brightway Place
- 9373 Ansley Ln
- 1683 Brightway Place
- 1690 Brightway Place
- 1681 Brightway Place
- 9351 Tree Line Ct
- 9354 Ansley Ln
- 9359 Ansley Ln
- 9375 Ansley Ln
- 9374 Ansley Ln
- 1682 Brightway Place