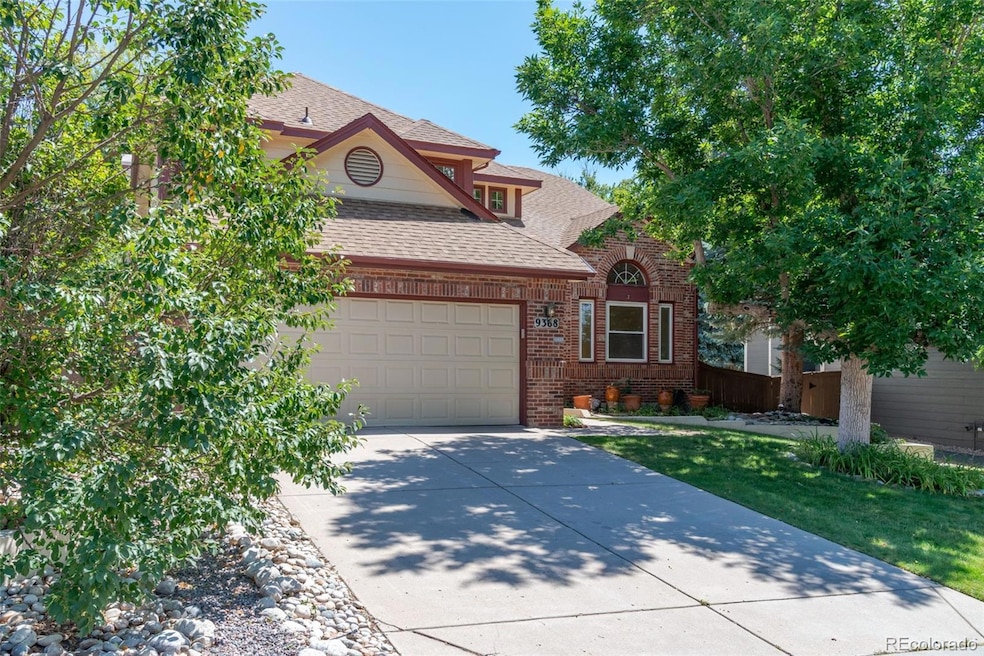
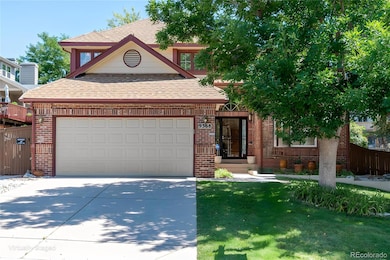
9368 Harvard Dr Highlands Ranch, CO 80130
Eastridge NeighborhoodEstimated payment $4,204/month
Highlights
- Open Floorplan
- Vaulted Ceiling
- Wood Flooring
- Fox Creek Elementary School Rated A-
- Traditional Architecture
- Granite Countertops
About This Home
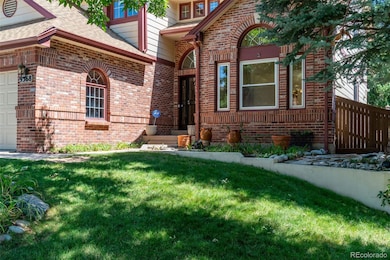
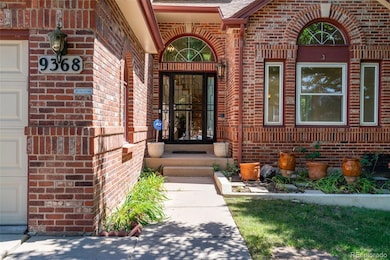
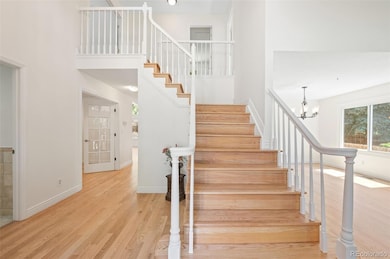
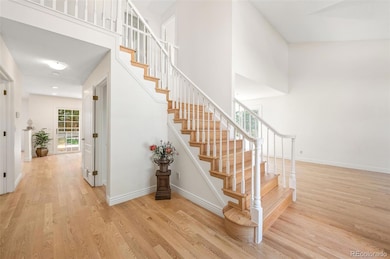
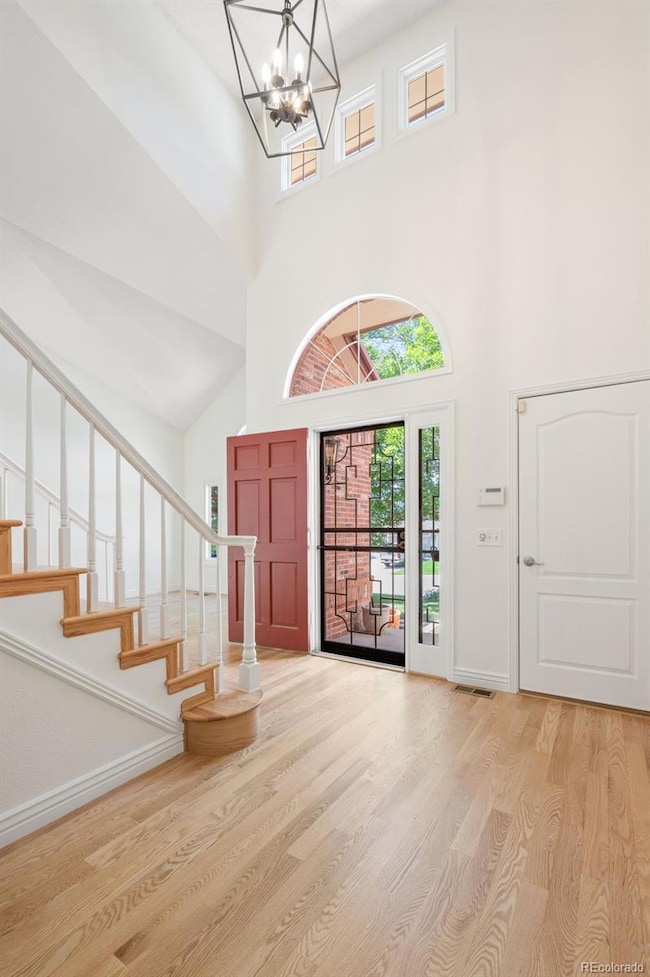
Welcome to 9368 Harvard Drive! Situated on a beautiful interior lot in the Eastridge neighborhood of Highlands Ranch, this home is sure to impress. Upon entering, you'll be in awe of the grand foyer and gleaming hardwood floors throughout. The contemporary yet classic layout, design and features will take your breath away. The living space flows seamlessly into the dining room, kitchen with eating space, a spacious family room complete with a fireplace, vaulted ceiling and large windows for an abundance of morning sunshine and a main floor bedroom or office with French Doors that connects to the 3/4 bathroom. Head upstairs to the primary bedroom suite complete with a large bathroom and walk-in closet. There are also two additional bedrooms which share a Jack and Jill full bathroom. The finished basement adds an additional 835+ square feet of living space which includes a 3/4 bathroom, storage space and an egress window. Additional upgrades between April - August 2025 include: new interior paint, refinished hardwood floors, new roof, new basement carpet, updated garage finish, refreshed landscaping, plus much more! Sit back, relax and enjoy your private backyard oasis with mature trees, an oversized deck, separate patio area and landscaping that will give you a true Colorado outdoor experience. The backyard is incredible and a place you will want to spend more time. You'll also appreciate the finished west facing, 2-car attached garage. Location! Location! Location! Situated in a sought-after community with its own gorgeous landscaping and resort-style amenities with their clubhouse, playgrounds and pools. Minutes from the Recreation Center at Eastridge, Park Meadows, schools, walking trails, restaurants, C-470, I-25 and so much more. You'll want to call this home your own!
Listing Agent
Compass - Denver Brokerage Email: TheNelsonTeam@gmail.com,303-522-5200 License #1317029 Listed on: 08/20/2025

Home Details
Home Type
- Single Family
Est. Annual Taxes
- $3,630
Year Built
- Built in 1987
Lot Details
- 7,449 Sq Ft Lot
- West Facing Home
- Property is Fully Fenced
- Private Yard
- Garden
- Property is zoned PDU
HOA Fees
- $57 Monthly HOA Fees
Parking
- 2 Car Attached Garage
- Lighted Parking
Home Design
- Traditional Architecture
- Brick Exterior Construction
- Frame Construction
- Composition Roof
Interior Spaces
- 2-Story Property
- Open Floorplan
- Vaulted Ceiling
- Wood Burning Fireplace
- Double Pane Windows
- Window Treatments
- Entrance Foyer
- Family Room with Fireplace
- Living Room
- Dining Room
Kitchen
- Oven
- Microwave
- Dishwasher
- Granite Countertops
- Disposal
Flooring
- Wood
- Carpet
- Tile
Bedrooms and Bathrooms
- Walk-In Closet
- Jack-and-Jill Bathroom
Laundry
- Laundry Room
- Dryer
- Washer
Finished Basement
- Partial Basement
- Interior Basement Entry
Home Security
- Carbon Monoxide Detectors
- Fire and Smoke Detector
Outdoor Features
- Covered Patio or Porch
- Exterior Lighting
- Rain Gutters
Schools
- Fox Creek Elementary School
- Cresthill Middle School
- Highlands Ranch
Utilities
- Forced Air Heating and Cooling System
- Heating System Uses Natural Gas
- Natural Gas Connected
Listing and Financial Details
- Exclusions: Seller's Personal Belongings and Staging Items
- Assessor Parcel Number R0338134
Community Details
Overview
- Association fees include ground maintenance, recycling, trash
- Hrca Association, Phone Number (303) 791-2500
- Eastridge Subdivision
Recreation
- Community Playground
- Community Pool
- Park
- Trails
Map
Home Values in the Area
Average Home Value in this Area
Tax History
| Year | Tax Paid | Tax Assessment Tax Assessment Total Assessment is a certain percentage of the fair market value that is determined by local assessors to be the total taxable value of land and additions on the property. | Land | Improvement |
|---|---|---|---|---|
| 2024 | $3,630 | $48,890 | $10,580 | $38,310 |
| 2023 | $3,623 | $48,890 | $10,580 | $38,310 |
| 2022 | $2,489 | $34,190 | $7,200 | $26,990 |
| 2021 | $2,588 | $34,190 | $7,200 | $26,990 |
| 2020 | $2,400 | $33,030 | $6,890 | $26,140 |
| 2019 | $2,409 | $33,030 | $6,890 | $26,140 |
| 2018 | $2,111 | $29,550 | $6,020 | $23,530 |
| 2017 | $1,922 | $29,550 | $6,020 | $23,530 |
| 2016 | $1,718 | $27,550 | $5,830 | $21,720 |
| 2015 | $2,467 | $27,550 | $5,830 | $21,720 |
| 2014 | $2,177 | $22,440 | $4,780 | $17,660 |
Property History
| Date | Event | Price | List to Sale | Price per Sq Ft |
|---|---|---|---|---|
| 10/30/2025 10/30/25 | Price Changed | $730,000 | -1.4% | $231 / Sq Ft |
| 09/23/2025 09/23/25 | Price Changed | $740,000 | -2.6% | $234 / Sq Ft |
| 08/20/2025 08/20/25 | For Sale | $760,000 | -- | $241 / Sq Ft |
Purchase History
| Date | Type | Sale Price | Title Company |
|---|---|---|---|
| Warranty Deed | $310,000 | -- | |
| Warranty Deed | $195,000 | -- | |
| Warranty Deed | $158,400 | -- | |
| Warranty Deed | $145,500 | -- | |
| Warranty Deed | $144,800 | -- | |
| Warranty Deed | $1,571,700 | -- |
Mortgage History
| Date | Status | Loan Amount | Loan Type |
|---|---|---|---|
| Previous Owner | $175,500 | No Value Available |
Source: REcolorado®
MLS Number: 5406515
APN: 2231-081-08-005
Disclaimer: Certain information contained herein is derived from information provided by parties other than Homes.com. All information provided is deemed reliable, but is not guaranteed to be accurate and should be independently verified.
![]() The content relating to real estate for sale in this Web site comes in part from the Internet Data eXchange (“IDX”) program of METROLIST, INC., DBA RECOLORADO®. Real estate listings held by brokers other than Ten-X are marked with the IDX Logo. This information is being provided for the consumers’ personal, non-commercial use and may not be used for any other purpose. All information subject to change and should be independently verified.
The content relating to real estate for sale in this Web site comes in part from the Internet Data eXchange (“IDX”) program of METROLIST, INC., DBA RECOLORADO®. Real estate listings held by brokers other than Ten-X are marked with the IDX Logo. This information is being provided for the consumers’ personal, non-commercial use and may not be used for any other purpose. All information subject to change and should be independently verified.
This publication is designed to provide information with regard to the subject matter covered. It is displayed with the understanding that the publisher and authors are not engaged in rendering real estate, legal, accounting, tax, or other professional services and that the publisher and authors are not offering such advice in this publication. If real estate, legal, or other expert assistance is required, the services of a competent, professional person should be sought.
The information contained in this publication is subject to change without notice. METROLIST, INC., DBA RECOLORADO MAKES NO WARRANTY OF ANY KIND WITH REGARD TO THIS MATERIAL, INCLUDING, BUT NOT LIMITED TO, THE IMPLIED WARRANTIES OF MERCHANTABILITY AND FITNESS FOR A PARTICULAR PURPOSE. METROLIST, INC., DBA RECOLORADO SHALL NOT BE LIABLE FOR ERRORS CONTAINED HEREIN OR FOR ANY DAMAGES IN CONNECTION WITH THE FURNISHING, PERFORMANCE, OR USE OF THIS MATERIAL.
PUBLISHER’S NOTICE: All real estate advertised herein is subject to the Federal Fair Housing Act and the Colorado Fair Housing Act, which Acts make it illegal to make or publish any advertisement that indicates any preference, limitation, or discrimination based on race, color, religion, sex, handicap, familial status, or national origin.
METROLIST, INC., DBA RECOLORADO will not knowingly accept any advertising for real estate that is in violation of the law. All persons are hereby informed that all dwellings advertised are available on an equal opportunity basis.
© 2025 METROLIST, INC., DBA RECOLORADO® – All Rights Reserved. 6455 S. Yosemite St., Suite 500 Greenwood Village, CO 80111 USA
ALL RIGHTS RESERVED WORLDWIDE. No part of this publication may be reproduced, adapted, translated, stored in a retrieval system or transmitted in any form or by any means, electronic, mechanical, photocopying, recording, or otherwise, without the prior written permission of the publisher. The information contained herein including but not limited to all text, photographs, digital images, virtual tours, may be seeded and monitored for protection and tracking.
- 9390 Yale Ln
- 9471 Burlington Ln
- 6239 Trailhead Rd
- 6141 Trailhead Rd
- 6723 Amherst Ct
- 6109 Trailhead Rd
- 6426 Nassau Ct
- 6717 Millstone St
- 7146 Newhall Dr
- 7404 La Quinta Ln
- 9275 Erminedale Dr
- 9682 Hemlock Ct
- 7469 La Quinta Place
- 9696 Pinebrook St
- 6266 Nassau Ct
- 9412 La Quinta Way
- 9222 Buttonhill Ct
- 6887 Chestnut Hill St
- 9888 Falcon Creek Dr
- 6482 Silver Mesa Dr Unit B
- 6249 Trailhead Rd
- 9691 Millstone Ct
- 9470 Kemper Dr
- 13134 Peacock Dr
- 5253 Wangaratta Way
- 6700 Palomino Pkwy
- 5005 Weeping Willow Cir
- 8637 Gold Peak Dr Unit B
- 5425 E Knoll Place
- 9484 Southern Hills Cir
- 4927 Tarcoola Ln
- 8716 Redwing Ave
- 9005 S Yosemite St
- 8225 S Poplar Way
- 9760 Rosemont Ave
- 4244 Lark Sparrow St
- 4644 Copeland Loop
- 4709 Fenwood Dr
- 4569 Copeland Loop Unit 101
- 4892 Waldenwood Dr