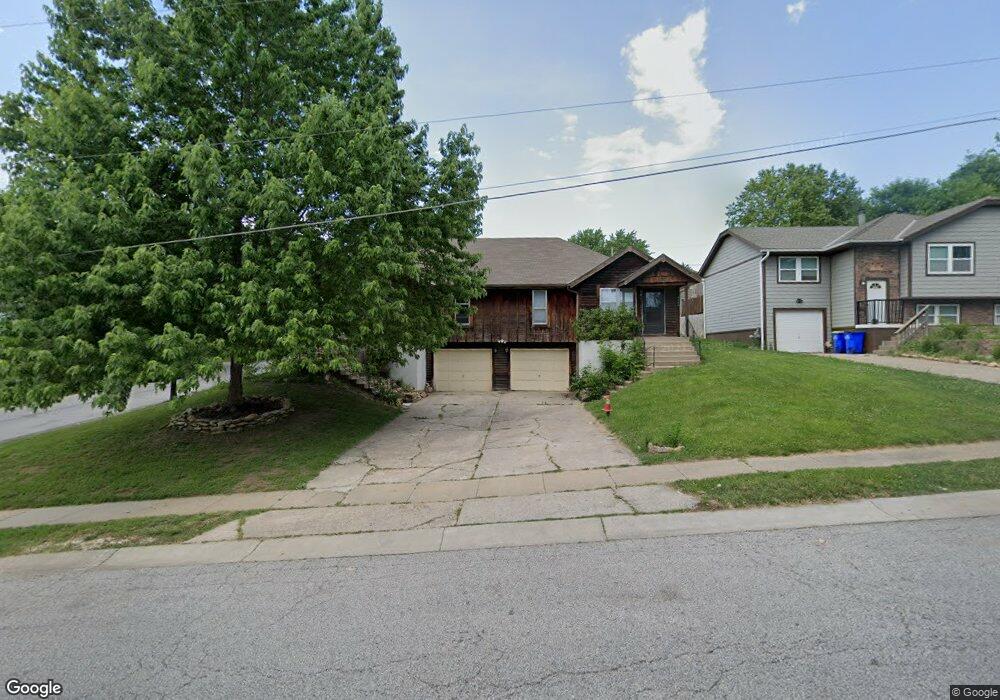
9368 W 49th St Shawnee, KS 66203
Estimated Value: $296,000 - $334,299
4
Beds
2
Baths
1,812
Sq Ft
$176/Sq Ft
Est. Value
About This Home
This home is located at 9368 W 49th St, Shawnee, KS 66203 and is currently estimated at $319,575, approximately $176 per square foot. 9368 W 49th St is a home located in Johnson County with nearby schools including Merriam Park Elementary School, Hocker Grove Middle School, and Shawnee Mission North High School.
Ownership History
Date
Name
Owned For
Owner Type
Purchase Details
Closed on
Jun 30, 2020
Sold by
Melvold Dianne K
Bought by
Melvold William J and Melvold Family Investment Trus
Current Estimated Value
Purchase Details
Closed on
Sep 14, 2007
Sold by
Satterfield Fred
Bought by
Indymac Bank Fsb
Home Financials for this Owner
Home Financials are based on the most recent Mortgage that was taken out on this home.
Original Mortgage
$80,000
Interest Rate
6.71%
Mortgage Type
New Conventional
Purchase Details
Closed on
Jul 16, 2007
Sold by
Melvold Dianne K
Bought by
Melvold Dianne K and Dianne Melvold 2004 Trust
Home Financials for this Owner
Home Financials are based on the most recent Mortgage that was taken out on this home.
Original Mortgage
$80,000
Interest Rate
6.71%
Mortgage Type
New Conventional
Create a Home Valuation Report for This Property
The Home Valuation Report is an in-depth analysis detailing your home's value as well as a comparison with similar homes in the area
Home Values in the Area
Average Home Value in this Area
Purchase History
| Date | Buyer | Sale Price | Title Company |
|---|---|---|---|
| Melvold William J | -- | None Available | |
| Melvold Dianne K | -- | None Available | |
| Indymac Bank Fsb | $169,281 | None Available | |
| Melvold Dianne K | -- | Old Republic Title Of Kansas | |
| Melvold Dianne K | -- | Old Republic Title |
Source: Public Records
Mortgage History
| Date | Status | Borrower | Loan Amount |
|---|---|---|---|
| Previous Owner | Melvold Dianne K | $80,000 |
Source: Public Records
Tax History Compared to Growth
Tax History
| Year | Tax Paid | Tax Assessment Tax Assessment Total Assessment is a certain percentage of the fair market value that is determined by local assessors to be the total taxable value of land and additions on the property. | Land | Improvement |
|---|---|---|---|---|
| 2024 | $2,952 | $27,957 | $5,088 | $22,869 |
| 2023 | $2,772 | $26,623 | $5,088 | $21,535 |
| 2022 | $2,514 | $23,311 | $4,621 | $18,690 |
| 2021 | $2,514 | $19,607 | $4,195 | $15,412 |
| 2020 | $2,106 | $18,492 | $3,652 | $14,840 |
| 2019 | $2,049 | $17,975 | $3,174 | $14,801 |
| 2018 | $1,830 | $16,020 | $2,881 | $13,139 |
| 2017 | $1,694 | $14,651 | $2,881 | $11,770 |
| 2016 | $1,567 | $13,421 | $2,881 | $10,540 |
| 2015 | $1,478 | $12,777 | $2,881 | $9,896 |
| 2013 | -- | $12,133 | $2,881 | $9,252 |
Source: Public Records
Map
Nearby Homes
- 9201 W 48th Terrace
- 5003 Knox Ave
- 9012 W 49th St
- 9328 W 51st St
- 4807 Oliver Ct
- 5220 Hayes St
- 0 W 49th St
- 9929 W 52nd St
- 5405 Oliver St
- 5029 Forest Ave
- 2925 S 52nd St
- 4905 Vista St
- 9719 W 53rd St
- 2913 S 52nd St
- 2918 S 52nd St
- 2918 S 52nd Terrace
- 4820 Hadley St
- 10116 W 52nd Terrace
- 5118 Forest Ave
- 5006 Woodend Ave
- 9364 W 49th St
- 9360 W 49th St
- 9371 W 48th Terrace
- 9356 W 49th St
- 9375 W 48th Terrace
- 9367 W 48th Terrace
- 4850 Hayes St
- 9363 W 48th Terrace
- 9352 W 49th St
- 4840 Hayes St
- 9359 W 48th Terrace
- 9401 W 48th Terrace
- 9355 W 48th Terrace
- 9411 W 49th St
- 9344 W 49th St
- 9500 W 49th St
- 9405 W 48th Terrace
- 9409 W 49th St
- 9415 W 49th St
- 9502 W 49th St