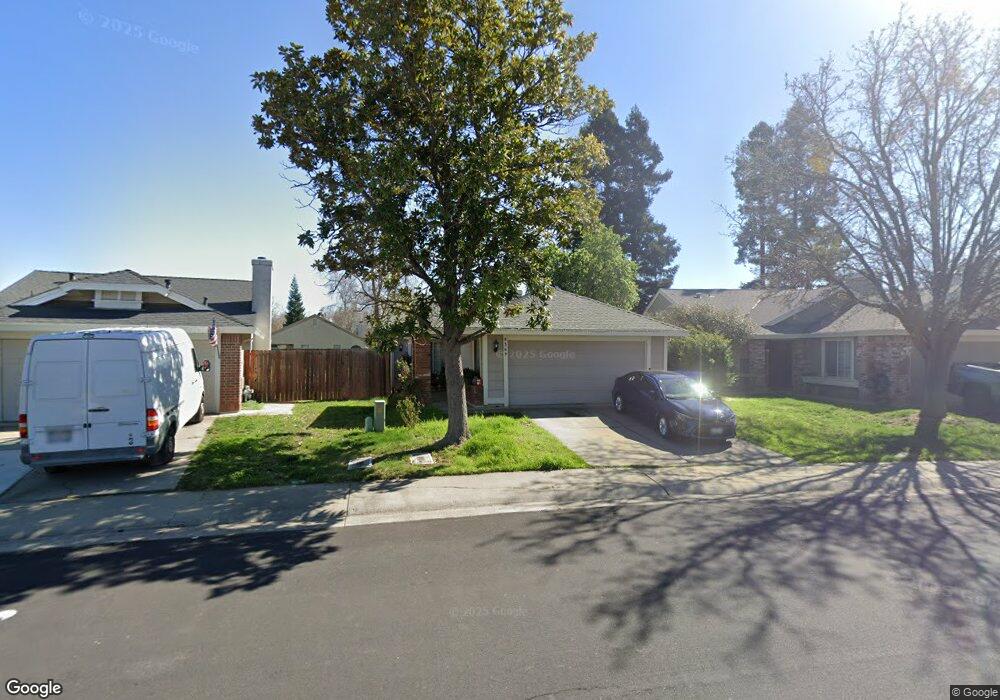
9369 Hoyleton Way Elk Grove, CA 95758
North West Elk Grove NeighborhoodEstimated Value: $149,000 - $461,000
2
Beds
2
Baths
1,006
Sq Ft
$378/Sq Ft
Est. Value
About This Home
This home is located at 9369 Hoyleton Way, Elk Grove, CA 95758 and is currently estimated at $380,128, approximately $377 per square foot. 9369 Hoyleton Way is a home located in Sacramento County with nearby schools including Elitha Donner Elementary School, Harriet G. Eddy Middle School, and Laguna Creek High School.
Ownership History
Date
Name
Owned For
Owner Type
Purchase Details
Closed on
Mar 4, 2011
Sold by
Loomis Carmen
Bought by
Merino Jose L
Current Estimated Value
Home Financials for this Owner
Home Financials are based on the most recent Mortgage that was taken out on this home.
Original Mortgage
$112,000
Outstanding Balance
$76,664
Interest Rate
4.71%
Mortgage Type
New Conventional
Estimated Equity
$303,464
Purchase Details
Closed on
Feb 13, 2004
Sold by
Lebeau Michael T
Bought by
Loomis Carmen
Purchase Details
Closed on
Apr 9, 1998
Sold by
Baker Doris M
Bought by
Lebeau Michael T
Home Financials for this Owner
Home Financials are based on the most recent Mortgage that was taken out on this home.
Original Mortgage
$105,964
Interest Rate
7.18%
Mortgage Type
FHA
Purchase Details
Closed on
Jun 29, 1995
Sold by
Baker Doris M
Bought by
Baker Doris M
Create a Home Valuation Report for This Property
The Home Valuation Report is an in-depth analysis detailing your home's value as well as a comparison with similar homes in the area
Home Values in the Area
Average Home Value in this Area
Purchase History
| Date | Buyer | Sale Price | Title Company |
|---|---|---|---|
| Merino Jose L | $140,000 | Inter County Title Co | |
| Loomis Carmen | $235,000 | Commonwealth Land Title Co | |
| Lebeau Michael T | $107,000 | Chicago Title Co | |
| Lebeau Michael T | -- | Chicago Title Co | |
| Baker Doris M | -- | -- |
Source: Public Records
Mortgage History
| Date | Status | Borrower | Loan Amount |
|---|---|---|---|
| Open | Merino Jose L | $112,000 | |
| Previous Owner | Lebeau Michael T | $105,964 |
Source: Public Records
Tax History Compared to Growth
Tax History
| Year | Tax Paid | Tax Assessment Tax Assessment Total Assessment is a certain percentage of the fair market value that is determined by local assessors to be the total taxable value of land and additions on the property. | Land | Improvement |
|---|---|---|---|---|
| 2025 | $2,341 | $179,352 | $76,865 | $102,487 |
| 2024 | $2,341 | $175,836 | $75,358 | $100,478 |
| 2023 | $2,281 | $172,389 | $73,881 | $98,508 |
| 2022 | $2,231 | $169,010 | $72,433 | $96,577 |
| 2021 | $2,187 | $165,697 | $71,013 | $94,684 |
| 2020 | $2,157 | $163,999 | $70,285 | $93,714 |
| 2019 | $2,116 | $160,784 | $68,907 | $91,877 |
| 2018 | $2,281 | $157,632 | $67,556 | $90,076 |
| 2017 | $2,025 | $154,542 | $66,232 | $88,310 |
| 2016 | $1,932 | $151,513 | $64,934 | $86,579 |
| 2015 | $1,900 | $149,238 | $63,959 | $85,279 |
| 2014 | $1,872 | $146,316 | $62,707 | $83,609 |
Source: Public Records
Map
Nearby Homes
- 9357 Hoyleton Way
- 7801 Melfort Way
- 7905 Baldur Ct
- 8397 Crystal Walk Cir
- 8464 Crystal Walk Cir
- 9252 Faraway Place
- 9217 Trenholm Dr
- 9510 Village Tree Dr
- 9364 Ivydale Cir
- 7300 Saltgrass Way
- 9550 Village Tree Dr
- 9578 Dunkerrin Way
- 9508 Delburns Ct
- 8200 Burloak Way
- 7120 Beaver Falls Way
- 7109 Ballygar Way
- 8288 Primoak Way
- 7105 Fall Way
- 9193 Bungalow Way
- 9438 Dunkerrin Way
- 9373 Hoyleton Way
- 9365 Hoyleton Way
- 9377 Hoyleton Way
- 9361 Hoyleton Way
- 9430 Trenholm Dr
- 9434 Trenholm Dr
- 9424 Trenholm Dr
- 9420 Trenholm Dr
- 9440 Trenholm Dr
- 9381 Hoyleton Way
- 9364 Hoyleton Way
- 9372 Hoyleton Way
- 9444 Trenholm Dr
- 9414 Trenholm Dr
- 9356 Hoyleton Way
- 9385 Hoyleton Way
- 9380 Hoyleton Way
- 9450 Trenholm Dr
- 9410 Trenholm Dr
- 9353 Hoyleton Way