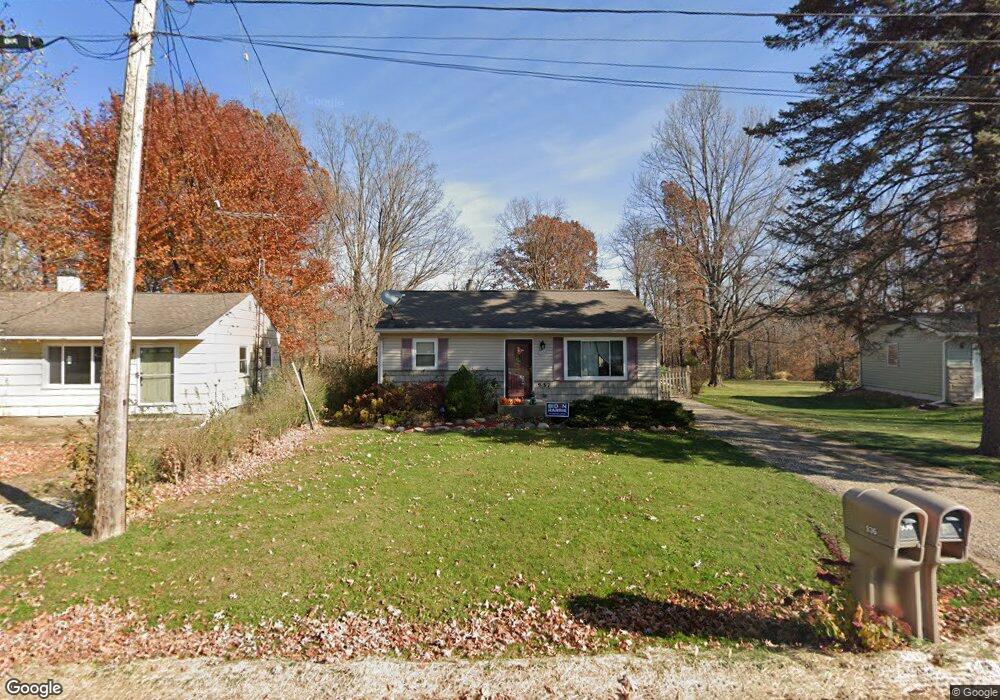
937 Belton Ave Battle Creek, MI 49014
Estimated Value: $151,358 - $207,000
2
Beds
2
Baths
1,028
Sq Ft
$172/Sq Ft
Est. Value
About This Home
This home is located at 937 Belton Ave, Battle Creek, MI 49014 and is currently estimated at $176,340, approximately $171 per square foot. 937 Belton Ave is a home located in Calhoun County with nearby schools including Harper Creek Middle School, Harper Creek High School, and Arbor Academy.
Ownership History
Date
Name
Owned For
Owner Type
Purchase Details
Closed on
Jul 13, 2009
Sold by
Austin Carl I and Austin Pamela A
Bought by
Mobley Kelley E
Current Estimated Value
Home Financials for this Owner
Home Financials are based on the most recent Mortgage that was taken out on this home.
Original Mortgage
$102,606
Outstanding Balance
$67,577
Interest Rate
5.49%
Mortgage Type
FHA
Estimated Equity
$108,763
Purchase Details
Closed on
Nov 24, 2004
Sold by
Brownell Matthew G and Brownell Daniel L
Bought by
Austin Carl I and Austin Pamela A
Create a Home Valuation Report for This Property
The Home Valuation Report is an in-depth analysis detailing your home's value as well as a comparison with similar homes in the area
Home Values in the Area
Average Home Value in this Area
Purchase History
| Date | Buyer | Sale Price | Title Company |
|---|---|---|---|
| Mobley Kelley E | $104,500 | Chicago Title Of Michigan | |
| Austin Carl I | $55,000 | Chicago Title |
Source: Public Records
Mortgage History
| Date | Status | Borrower | Loan Amount |
|---|---|---|---|
| Open | Mobley Kelley E | $102,606 |
Source: Public Records
Tax History Compared to Growth
Tax History
| Year | Tax Paid | Tax Assessment Tax Assessment Total Assessment is a certain percentage of the fair market value that is determined by local assessors to be the total taxable value of land and additions on the property. | Land | Improvement |
|---|---|---|---|---|
| 2025 | $1,816 | $67,510 | $0 | $0 |
| 2024 | $1,043 | $62,490 | $0 | $0 |
| 2023 | $1,603 | $55,910 | $0 | $0 |
| 2022 | $946 | $48,690 | $0 | $0 |
| 2021 | $1,532 | $48,950 | $0 | $0 |
| 2020 | $1,561 | $44,250 | $0 | $0 |
| 2019 | $1,778 | $41,950 | $0 | $0 |
| 2018 | $1,342 | $38,700 | $4,250 | $34,450 |
| 2017 | $1,342 | $37,650 | $0 | $0 |
| 2016 | $1,342 | $36,750 | $0 | $0 |
| 2015 | $969 | $35,500 | $3,111 | $32,389 |
| 2014 | $969 | $39,750 | $3,111 | $36,639 |
Source: Public Records
Map
Nearby Homes