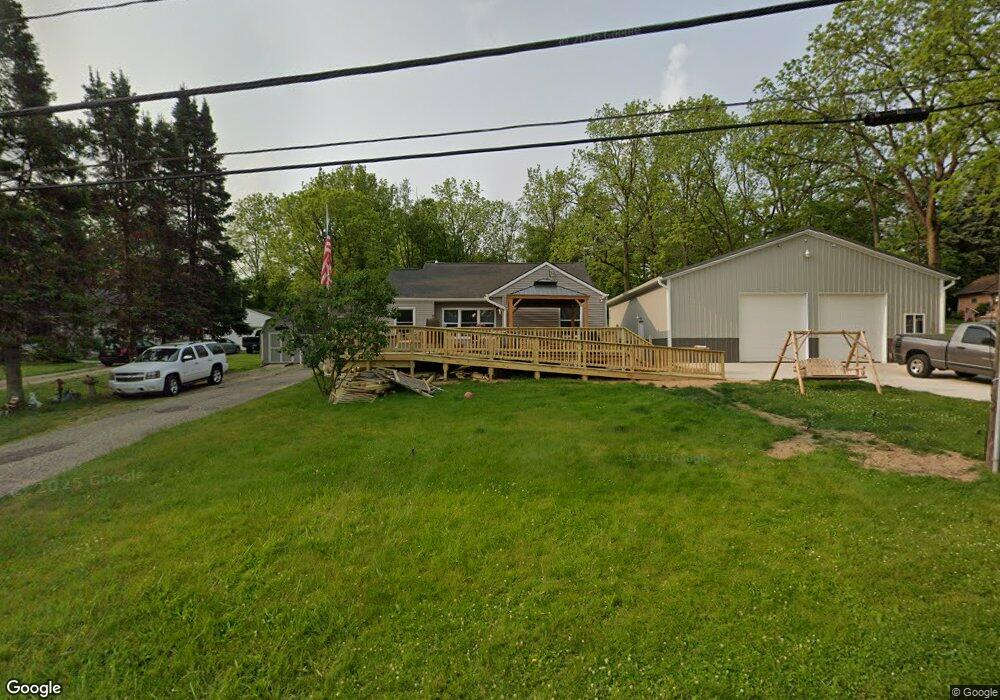
937 Betterly Rd Springfield, MI 49037
Estimated Value: $138,660 - $163,000
3
Beds
1
Bath
964
Sq Ft
$156/Sq Ft
Est. Value
About This Home
This home is located at 937 Betterly Rd, Springfield, MI 49037 and is currently estimated at $150,665, approximately $156 per square foot. 937 Betterly Rd is a home located in Calhoun County with nearby schools including Valley View Elementary School, Springfield Middle School, and Battle Creek Central High School.
Ownership History
Date
Name
Owned For
Owner Type
Purchase Details
Closed on
Jun 21, 2023
Sold by
Pour Over Trust and Pour Over Trust
Bought by
Bridges Carl and Lubking Mary Jane
Current Estimated Value
Home Financials for this Owner
Home Financials are based on the most recent Mortgage that was taken out on this home.
Original Mortgage
$115,588
Outstanding Balance
$112,663
Interest Rate
6.69%
Estimated Equity
$38,002
Purchase Details
Closed on
Mar 14, 2008
Sold by
Rose David Alan and Rose Cheryl Louise
Bought by
Rose David Alan and Rose Cheryl Louise
Purchase Details
Closed on
Aug 1, 2005
Sold by
Rose David A and Rose Cheryl L
Bought by
Bridges Carl and Lubking Mary Jane
Purchase Details
Closed on
Jul 29, 2005
Sold by
Pippin Carol A and Storm Keith A
Bought by
Rose David A
Purchase Details
Closed on
Jan 24, 2005
Sold by
Storm Keith A and Storm Blanche B
Bought by
Storm Keith A and Pippin Carol A
Create a Home Valuation Report for This Property
The Home Valuation Report is an in-depth analysis detailing your home's value as well as a comparison with similar homes in the area
Home Values in the Area
Average Home Value in this Area
Purchase History
| Date | Buyer | Sale Price | Title Company |
|---|---|---|---|
| Bridges Carl | $63,250 | Ata National Title Group | |
| Rose David Alan | -- | Fatic | |
| Bridges Carl | $63,250 | Fatic | |
| Rose David A | $49,000 | Metropolitan Title Company | |
| Storm Keith A | -- | -- |
Source: Public Records
Mortgage History
| Date | Status | Borrower | Loan Amount |
|---|---|---|---|
| Open | Bridges Carl | $115,588 | |
| Closed | Bridges Carl | $0 |
Source: Public Records
Tax History
| Year | Tax Paid | Tax Assessment Tax Assessment Total Assessment is a certain percentage of the fair market value that is determined by local assessors to be the total taxable value of land and additions on the property. | Land | Improvement |
|---|---|---|---|---|
| 2025 | $1,202 | $63,313 | $0 | $0 |
| 2024 | $879 | $50,184 | $0 | $0 |
| 2023 | $1,012 | $37,180 | $0 | $0 |
| 2022 | $797 | $33,580 | $0 | $0 |
| 2021 | $948 | $32,776 | $0 | $0 |
| 2020 | $935 | $31,752 | $0 | $0 |
| 2019 | $914 | $31,239 | $0 | $0 |
| 2018 | $0 | $26,489 | $5,986 | $20,503 |
| 2017 | $0 | $26,159 | $0 | $0 |
| 2016 | $0 | $20,561 | $0 | $0 |
| 2015 | -- | $18,612 | $0 | $0 |
| 2014 | -- | $20,573 | $0 | $0 |
Source: Public Records
Map
Nearby Homes
- 50 Wellworth Ave
- 294 20th St N
- 248 23rd St N
- 396 & 398 N 20th St
- 745 Upton Ave
- 690 Upton Ave
- 185 Kirkwood Ave
- 431 22nd St N
- 172 25th St N
- 153 23rd St N
- 430 21st St N
- 446 24th St N
- 121 21st St N
- 141 Wiltshire Ave
- 1332 W Highland Blvd
- 113 31st St N
- 250 N 16th St
- 83 N La Vista Blvd
- 68 Pleasant Ave
- 27 20th St N
- 1005 Betterly Rd
- 935 Betterly Rd
- 329 22nd St N
- 1009 Betterly Rd
- 350 22nd St N Unit 1
- 350 22nd St N
- 325 22nd St N
- 353 22nd St N
- 348 Richfield Ave
- 346 Richfield Ave
- 1015 Betterly Rd
- 328 Richfield Ave
- 915 Betterly Rd
- 915 Betterly Rd
- 324 Richfield Ave
- 2205 W Dickman Rd
- 402 Richfield Ave
- 320 Richfield Ave
- 430 Richfield Ave
- 401 Richfield Ave
Your Personal Tour Guide
Ask me questions while you tour the home.