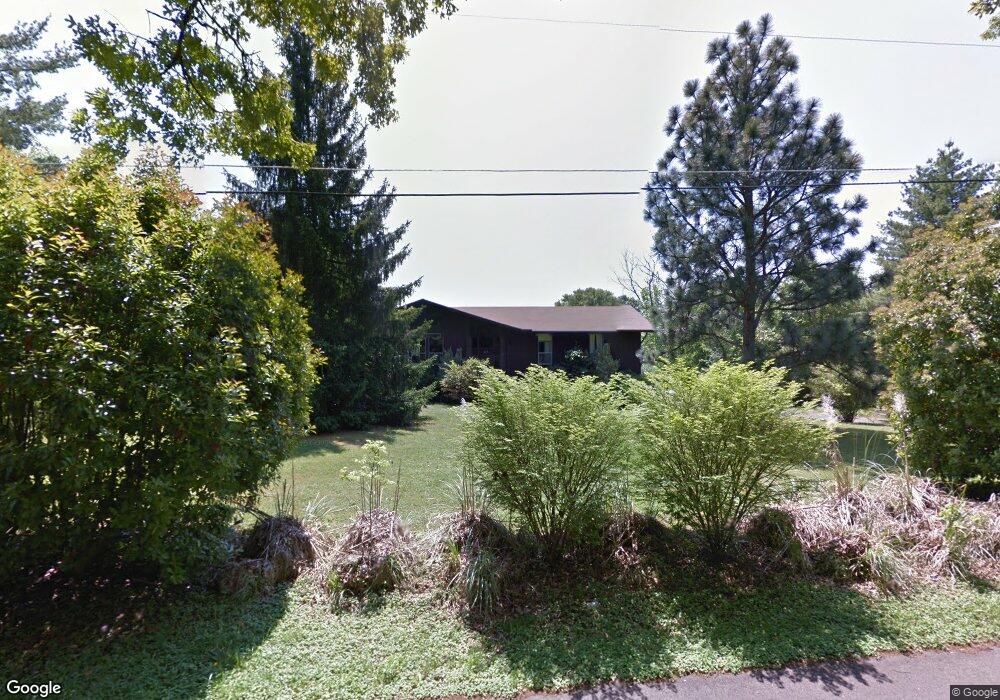
937 Chris Haven Dr N Seymour, TN 37865
Estimated Value: $314,185 - $400,000
--
Bed
2
Baths
1,521
Sq Ft
$238/Sq Ft
Est. Value
About This Home
This home is located at 937 Chris Haven Dr N, Seymour, TN 37865 and is currently estimated at $362,296, approximately $238 per square foot. 937 Chris Haven Dr N is a home located in Blount County with nearby schools including Prospect Elementary School, Heritage Middle School, and Heritage High School.
Ownership History
Date
Name
Owned For
Owner Type
Purchase Details
Closed on
Mar 14, 2014
Sold by
Martin David L
Bought by
Garner Sharity Even
Current Estimated Value
Purchase Details
Closed on
Apr 22, 2002
Sold by
Hegele Wade
Bought by
Martin David
Purchase Details
Closed on
May 4, 1999
Sold by
Adams Robert
Bought by
Thomas Hugh
Purchase Details
Closed on
Apr 6, 1999
Sold by
Hegele Wade
Bought by
Adams Robert
Purchase Details
Closed on
Feb 22, 1999
Sold by
Houk Monty
Bought by
Hegele Wade
Purchase Details
Closed on
Feb 10, 1999
Sold by
Houk Monty
Bought by
Houk Monty
Purchase Details
Closed on
Nov 2, 1998
Sold by
Breeden Fred S and Breeden Debra A
Bought by
Norwood Lloyd
Purchase Details
Closed on
Jun 13, 1989
Bought by
Breeden Fred S and Breeden Debra A
Purchase Details
Closed on
Aug 11, 1980
Bought by
Breeden Fred S
Create a Home Valuation Report for This Property
The Home Valuation Report is an in-depth analysis detailing your home's value as well as a comparison with similar homes in the area
Home Values in the Area
Average Home Value in this Area
Purchase History
| Date | Buyer | Sale Price | Title Company |
|---|---|---|---|
| Garner Sharity Even | -- | -- | |
| Martin David | $127,500 | -- | |
| Thomas Hugh | $152,450 | -- | |
| Adams Robert | $76,650 | -- | |
| Hegele Wade | $103,500 | -- | |
| Houk Monty | $12,700 | -- | |
| Norwood Lloyd | $11,500 | -- | |
| Breeden Fred S | -- | -- | |
| Breeden Fred S | -- | -- |
Source: Public Records
Tax History Compared to Growth
Tax History
| Year | Tax Paid | Tax Assessment Tax Assessment Total Assessment is a certain percentage of the fair market value that is determined by local assessors to be the total taxable value of land and additions on the property. | Land | Improvement |
|---|---|---|---|---|
| 2025 | $1,113 | $69,975 | $0 | $0 |
| 2024 | $1,113 | $69,975 | $12,500 | $57,475 |
| 2023 | $1,113 | $69,975 | $12,500 | $57,475 |
| 2022 | $882 | $35,700 | $4,875 | $30,825 |
| 2021 | $882 | $35,700 | $4,875 | $30,825 |
| 2020 | $882 | $35,700 | $4,875 | $30,825 |
| 2019 | $882 | $35,700 | $4,875 | $30,825 |
| 2018 | $829 | $33,575 | $4,625 | $28,950 |
| 2017 | $829 | $33,575 | $4,625 | $28,950 |
| 2016 | $829 | $33,575 | $4,625 | $28,950 |
| 2015 | $722 | $33,575 | $4,625 | $28,950 |
| 2014 | $726 | $33,575 | $4,625 | $28,950 |
| 2013 | $726 | $33,750 | $0 | $0 |
Source: Public Records
Map
Nearby Homes
- 1137 Oakes Vista Ln
- 6116 Nails Creek Rd
- 862 Hinkle Estates Dr
- 437 Covenant Way
- 727 Ic King Rd
- 634 Crestview Ct
- 802 Hinkle Rd
- 715 Winston Dr
- Odie Plan at Farm Of The Smokies
- Smokey Plan at Farm Of The Smokies
- Stella Plan at Farm Of The Smokies
- 836 Franklin Crossing
- 426 Keeble Rd
- 524 Highland View Dr
- 5925 Sevierville Rd
- 0 Miller Cir
- 821 Franklin Crossing
- 623 Farm of the Smokies Way
- 511 Highland View Dr
- 815 Franklin Crossing
- 931 Chris Haven Dr N
- 941 Chris Haven Dr N
- 1026 Chris Dale Dr
- 1022 Chris Dale Dr
- 944 Chris Haven Dr N
- 927 Chris Haven Dr N
- 1030 Chris Dale Dr
- 923 Chris Haven Dr N
- 1036 Chris Dale Dr
- 930 Chris Haven Dr N
- 949 Chris Haven Dr N
- Lot Chris Dale Dr
- Lot Chris Dale Dr
- Lot 71 Chris Dale Dr
- Lot 70 Chris Dale Dr
- 1010 Chris Dale Dr
- 1027 Chris Dale Dr
- 1021 Chris Dale Dr
- 1031 Chris Dale Dr
- 1040 Chris Dale Dr