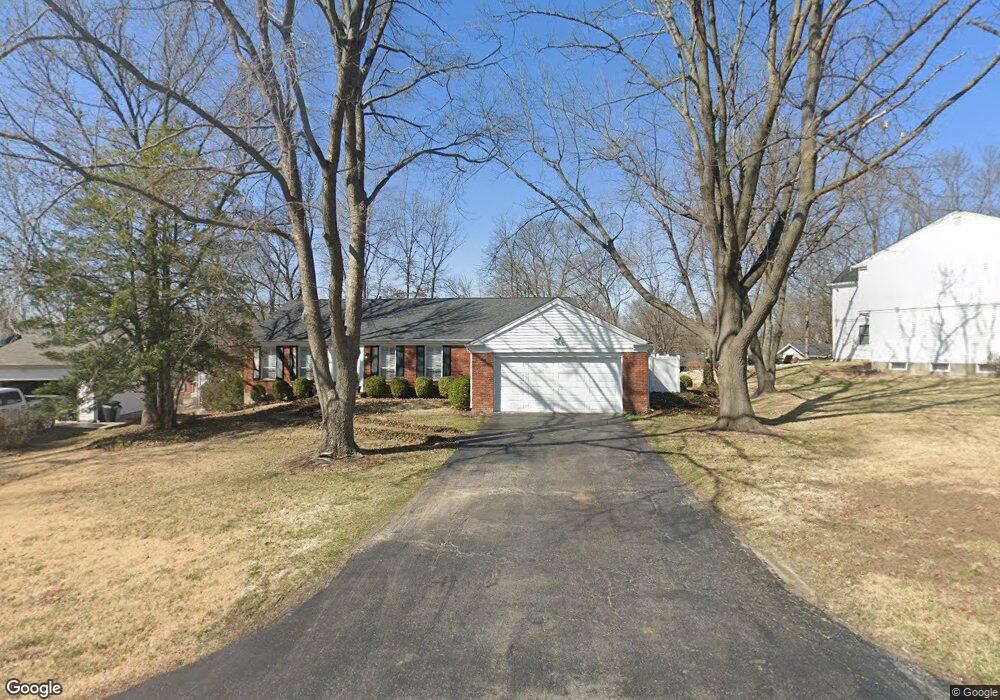
937 Morena Ct Ballwin, MO 63011
Estimated Value: $390,832 - $454,000
3
Beds
2
Baths
1,698
Sq Ft
$252/Sq Ft
Est. Value
About This Home
This home is located at 937 Morena Ct, Ballwin, MO 63011 and is currently estimated at $427,708, approximately $251 per square foot. 937 Morena Ct is a home located in St. Louis County with nearby schools including Kehrs Mill Elementary, Crestview Middle School, and Marquette Sr. High School.
Ownership History
Date
Name
Owned For
Owner Type
Purchase Details
Closed on
Jun 10, 2003
Sold by
Larocca Tiffany J and Larocca Eric P
Bought by
Larocca Eric P and Larocca Tiffany J
Current Estimated Value
Home Financials for this Owner
Home Financials are based on the most recent Mortgage that was taken out on this home.
Original Mortgage
$111,500
Outstanding Balance
$48,062
Interest Rate
5.56%
Mortgage Type
Purchase Money Mortgage
Estimated Equity
$379,646
Purchase Details
Closed on
Nov 16, 2001
Sold by
Byrd Keith A and Byrd Elizabeth P
Bought by
Consolo Tiffany
Home Financials for this Owner
Home Financials are based on the most recent Mortgage that was taken out on this home.
Original Mortgage
$111,900
Interest Rate
6.54%
Purchase Details
Closed on
Apr 7, 1999
Sold by
Barca Anthony J and Barca Mary R
Bought by
Byrd Keith A and Byrd Elizabeth P
Home Financials for this Owner
Home Financials are based on the most recent Mortgage that was taken out on this home.
Original Mortgage
$150,000
Interest Rate
6.12%
Create a Home Valuation Report for This Property
The Home Valuation Report is an in-depth analysis detailing your home's value as well as a comparison with similar homes in the area
Home Values in the Area
Average Home Value in this Area
Purchase History
| Date | Buyer | Sale Price | Title Company |
|---|---|---|---|
| Larocca Eric P | -- | -- | |
| Consolo Tiffany | $186,500 | -- | |
| Byrd Keith A | $158,000 | -- |
Source: Public Records
Mortgage History
| Date | Status | Borrower | Loan Amount |
|---|---|---|---|
| Open | Larocca Eric P | $111,500 | |
| Closed | Consolo Tiffany | $111,900 | |
| Previous Owner | Byrd Keith A | $150,000 |
Source: Public Records
Tax History
| Year | Tax Paid | Tax Assessment Tax Assessment Total Assessment is a certain percentage of the fair market value that is determined by local assessors to be the total taxable value of land and additions on the property. | Land | Improvement |
|---|---|---|---|---|
| 2025 | $4,816 | $72,500 | $30,590 | $41,910 |
| 2024 | $4,816 | $68,850 | $22,950 | $45,900 |
| 2023 | $4,812 | $68,850 | $22,950 | $45,900 |
| 2022 | $4,226 | $56,120 | $22,950 | $33,170 |
| 2021 | $4,195 | $56,120 | $22,950 | $33,170 |
| 2020 | $4,074 | $51,950 | $22,880 | $29,070 |
| 2019 | $4,090 | $51,950 | $22,880 | $29,070 |
| 2018 | $3,847 | $46,060 | $19,060 | $27,000 |
| 2016 | $3,594 | $42,370 | $14,310 | $28,060 |
Source: Public Records
Map
Nearby Homes
- 1026 Kehrs Mill Rd Unit 4
- 927 Claytonbrook Dr Unit 3
- 1050 Kehrs Mill Rd
- 916 Claytonbrook Dr Unit 1
- 922 Claytonbrook Dr Unit 1
- 1019 Claytonbrook Dr Unit 1019
- 2316 Coventry Farm Ct
- 2352 the Courts Dr
- 30 Meadowbrook Country Club Estate
- 2364 the Courts Dr
- 27 Meadowbrook Country Club Estate
- 568 Trevi Ln
- 313 Providence Rd
- 15911 Fairway Lake
- 538 Triton Way Dr
- 78 Meadowbrook Country Club Estate
- 502 Trevi Ln
- 2221 Stonegate Manor Ct
- 2698 Joyceridge Dr
- 351 Greenbriar Ln
- 943 Morena Ct
- 921 Morena Ct
- 910 Del Ebro Dr
- 908 Del Ebro Dr
- 918 Del Ebro Dr
- 949 Morena Ct
- 926 Del Ebro Dr
- 906 Del Ebro Dr
- 930 Morena Ct
- 922 Morena Ct
- 532 Nottingham Dr
- 955 Morena Ct
- 914 Morena Ct
- 903 Morena Ct
- 912 Camargo Dr
- 524 Nottingham Dr
- 960 Chartrand Dr
- 927 Del Ebro Dr
- 907 Camargo Dr
- 908 Morena Ct
Your Personal Tour Guide
Ask me questions while you tour the home.