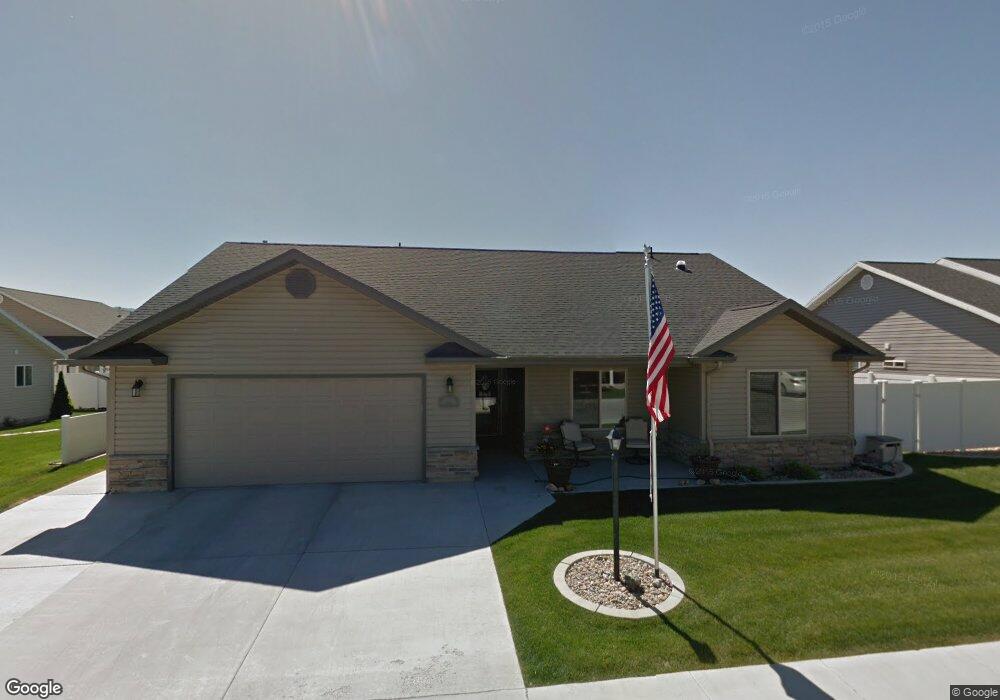
937 N 350 W Logan, UT 84321
Bridger NeighborhoodEstimated Value: $404,691 - $428,000
Studio
--
Bath
1,608
Sq Ft
$261/Sq Ft
Est. Value
About This Home
This home is located at 937 N 350 W, Logan, UT 84321 and is currently estimated at $418,923, approximately $260 per square foot. 937 N 350 W is a home with nearby schools including Bridger School, Mount Logan Middle School, and Logan High School.
Ownership History
Date
Name
Owned For
Owner Type
Purchase Details
Closed on
Aug 28, 2007
Sold by
Whitsel Joyce
Bought by
Whitsel Joyce
Current Estimated Value
Purchase Details
Closed on
Aug 10, 2007
Sold by
Champlin Development Inc
Bought by
Whitsel Joyce
Create a Home Valuation Report for This Property
The Home Valuation Report is an in-depth analysis detailing your home's value as well as a comparison with similar homes in the area
Home Values in the Area
Average Home Value in this Area
Purchase History
| Date | Buyer | Sale Price | Title Company |
|---|---|---|---|
| Whitsel Joyce | -- | Northern Title Company | |
| Whitsel Joyce | -- | Northern Title Company |
Source: Public Records
Tax History
| Year | Tax Paid | Tax Assessment Tax Assessment Total Assessment is a certain percentage of the fair market value that is determined by local assessors to be the total taxable value of land and additions on the property. | Land | Improvement |
|---|---|---|---|---|
| 2025 | $1,714 | $221,705 | $0 | $0 |
| 2023 | $1,849 | $220,825 | $0 | $0 |
| 2022 | $1,981 | $220,825 | $0 | $0 |
| 2021 | $1,549 | $266,768 | $42,000 | $224,768 |
| 2020 | $1,532 | $237,451 | $42,000 | $195,451 |
| 2019 | $1,601 | $237,451 | $42,000 | $195,451 |
| 2018 | $1,599 | $216,510 | $42,000 | $174,510 |
| 2017 | $1,599 | $114,510 | $0 | $0 |
| 2016 | $1,658 | $106,205 | $0 | $0 |
| 2015 | $1,540 | $106,205 | $0 | $0 |
| 2014 | $1,128 | $86,050 | $0 | $0 |
| 2013 | -- | $86,050 | $0 | $0 |
Source: Public Records
Map
Nearby Homes
Your Personal Tour Guide
Ask me questions while you tour the home.