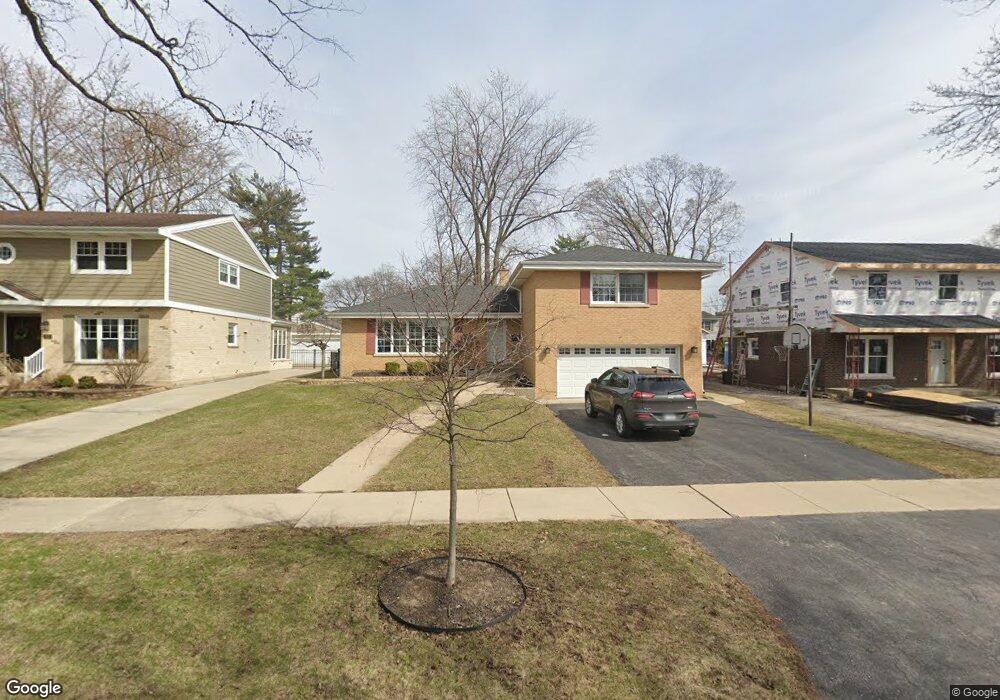
937 S Kent Ave Elmhurst, IL 60126
Estimated Value: $660,000 - $802,000
3
Beds
2
Baths
1,995
Sq Ft
$364/Sq Ft
Est. Value
About This Home
This home is located at 937 S Kent Ave, Elmhurst, IL 60126 and is currently estimated at $726,364, approximately $364 per square foot. 937 S Kent Ave is a home located in DuPage County with nearby schools including Pulaski Intl School of Chicago, Revere Elementary School, and Jackson Elementary School.
Ownership History
Date
Name
Owned For
Owner Type
Purchase Details
Closed on
Jan 21, 2021
Sold by
Didier Andrew P and Didier Jami Hager
Bought by
Didier Andrew P and Didier Jami H
Current Estimated Value
Purchase Details
Closed on
Oct 12, 2017
Sold by
Hamstra Donald and Hamstra Joyce
Bought by
Hager Didier Andrew P and Hager Didier Jami
Home Financials for this Owner
Home Financials are based on the most recent Mortgage that was taken out on this home.
Original Mortgage
$420,850
Outstanding Balance
$351,151
Interest Rate
3.78%
Mortgage Type
New Conventional
Estimated Equity
$375,214
Purchase Details
Closed on
Apr 5, 2002
Sold by
Swierenga Angeline
Bought by
Hamstra Donald and Hamstra Joyce
Home Financials for this Owner
Home Financials are based on the most recent Mortgage that was taken out on this home.
Original Mortgage
$341,100
Interest Rate
7.18%
Create a Home Valuation Report for This Property
The Home Valuation Report is an in-depth analysis detailing your home's value as well as a comparison with similar homes in the area
Home Values in the Area
Average Home Value in this Area
Purchase History
| Date | Buyer | Sale Price | Title Company |
|---|---|---|---|
| Didier Andrew P | -- | Attorney | |
| Hager Didier Andrew P | $443,000 | First American Title | |
| Hamstra Donald | $342,500 | First American Title |
Source: Public Records
Mortgage History
| Date | Status | Borrower | Loan Amount |
|---|---|---|---|
| Open | Hager Didier Andrew P | $420,850 | |
| Previous Owner | Hamstra Donald | $341,100 |
Source: Public Records
Tax History Compared to Growth
Tax History
| Year | Tax Paid | Tax Assessment Tax Assessment Total Assessment is a certain percentage of the fair market value that is determined by local assessors to be the total taxable value of land and additions on the property. | Land | Improvement |
|---|---|---|---|---|
| 2024 | $11,571 | $200,000 | $106,875 | $93,125 |
| 2023 | $10,746 | $185,000 | $98,830 | $86,170 |
| 2022 | $10,068 | $172,040 | $94,990 | $77,050 |
| 2021 | $9,819 | $167,760 | $92,630 | $75,130 |
| 2020 | $9,439 | $164,080 | $90,600 | $73,480 |
| 2019 | $9,240 | $156,000 | $86,140 | $69,860 |
| 2018 | $9,972 | $166,960 | $81,550 | $85,410 |
| 2017 | $9,755 | $159,100 | $77,710 | $81,390 |
| 2016 | $9,551 | $149,880 | $73,210 | $76,670 |
| 2015 | $9,458 | $139,630 | $68,200 | $71,430 |
| 2014 | $10,267 | $139,230 | $54,130 | $85,100 |
| 2013 | $10,155 | $141,190 | $54,890 | $86,300 |
Source: Public Records
Map
Nearby Homes
- 162 E Hale St
- 100 W Butterfield Rd Unit 112N
- 110 W Butterfield Rd Unit 502S
- 837 S Kearsage Ave
- 900 S Colfax Ave
- 936 S Mitchell Ave
- 1005 S Mitchell Ave
- 995 S Swain Ave
- 991 S Swain Ave
- 353 E Butterfield Rd
- 185 E Oneida Ave
- 963 S Saylor Ave
- 694 S York St
- 15W320 Concord St
- 680 S Bryan St
- 814 S Saylor Ave
- 175 W Brush Hill Rd Unit 404
- 341 E Madison St
- 801 S Spring Rd
- 805 S Spring Rd
- 933 S Kent Ave
- 941 S Kent Ave
- 929 S Kent Ave
- 947 S Kent Ave
- 936 S Kirk Ave
- 934 S Kirk Ave
- 938 S Kirk Ave
- 132 E Van Buren St
- 942 S Kirk Ave
- 930 S Kirk Ave
- 951 S Kent Ave
- 940 S Kent Ave
- 946 S Kirk Ave
- 148 E Van Buren St
- 934 S Kent Ave
- 944 S Kent Ave
- 920 S Kent Ave
- 957 S Kent Ave
- 948 S Kent Ave
- 118 E Van Buren St