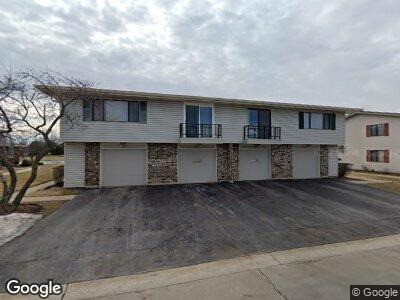
937 Shattuck Ln Unit 1281 Schaumburg, IL 60194
Hoover Park NeighborhoodEstimated Value: $227,000 - $243,499
3
Beds
--
Bath
--
Sq Ft
35
Acres
About This Home
This home is located at 937 Shattuck Ln Unit 1281, Schaumburg, IL 60194 and is currently estimated at $235,125. 937 Shattuck Ln Unit 1281 is a home located in Cook County with nearby schools including Enders-Salk Elementary School, Helen Keller Junior High School, and Schaumburg High School.
Ownership History
Date
Name
Owned For
Owner Type
Purchase Details
Closed on
Feb 29, 2024
Sold by
Amirthaseelan Joseph T and Amirthaseelan Shanthi
Bought by
Sun Magnolia Llc
Current Estimated Value
Purchase Details
Closed on
Jan 18, 2022
Sold by
Dong Min and Jin Weiqing
Bought by
Amirthaseelan Joseph T and Varadharajan Shanthi
Home Financials for this Owner
Home Financials are based on the most recent Mortgage that was taken out on this home.
Original Mortgage
$123,345
Interest Rate
2.75%
Purchase Details
Closed on
Nov 24, 2021
Sold by
Dong Min and Jin Weiqing
Bought by
Amirthaseelan Joseph T and Varadharajan Shanthi
Home Financials for this Owner
Home Financials are based on the most recent Mortgage that was taken out on this home.
Original Mortgage
$123,345
Interest Rate
2.75%
Purchase Details
Closed on
Oct 28, 2014
Sold by
Bartholomae Raymond E and Bartholomae Sharon L
Bought by
Jin Weiqing and Dong Min
Create a Home Valuation Report for This Property
The Home Valuation Report is an in-depth analysis detailing your home's value as well as a comparison with similar homes in the area
Home Values in the Area
Average Home Value in this Area
Purchase History
| Date | Buyer | Sale Price | Title Company |
|---|---|---|---|
| Sun Magnolia Llc | -- | None Listed On Document | |
| Amirthaseelan Joseph T | -- | -- | |
| Amirthaseelan Joseph T | -- | -- | |
| Amirthaseelan Joseph T | -- | -- | |
| Jin Weiqing | $108,000 | Attorneys Title Guaranty Fun |
Source: Public Records
Mortgage History
| Date | Status | Borrower | Loan Amount |
|---|---|---|---|
| Previous Owner | Amirthaseelan Joseph T | $123,345 | |
| Previous Owner | Amirthaseelan Joseph T | $123,345 |
Source: Public Records
Tax History Compared to Growth
Tax History
| Year | Tax Paid | Tax Assessment Tax Assessment Total Assessment is a certain percentage of the fair market value that is determined by local assessors to be the total taxable value of land and additions on the property. | Land | Improvement |
|---|---|---|---|---|
| 2024 | $4,269 | $15,716 | $4,946 | $10,770 |
| 2023 | $4,269 | $15,716 | $4,946 | $10,770 |
| 2022 | $4,269 | $15,716 | $4,946 | $10,770 |
| 2021 | $3,685 | $12,159 | $6,336 | $5,823 |
| 2020 | $3,622 | $12,159 | $6,336 | $5,823 |
| 2019 | $3,623 | $13,517 | $6,336 | $7,181 |
| 2018 | $2,531 | $8,432 | $5,332 | $3,100 |
| 2017 | $2,491 | $8,432 | $5,332 | $3,100 |
| 2016 | $2,329 | $8,432 | $5,332 | $3,100 |
| 2015 | $2,134 | $7,134 | $4,636 | $2,498 |
| 2014 | $2,111 | $7,134 | $4,636 | $2,498 |
| 2013 | $2,057 | $7,134 | $4,636 | $2,498 |
Source: Public Records
Map
Nearby Homes
- 231 Barcliffe Ln Unit 1012
- 317 Mashpee Ln
- 226 Patuxet Ct Unit 1492
- 160 Washington Blvd
- 1035 W Schaumburg Rd
- 1089 Roslyn Ct
- 1101 Roslyn Ln
- 140 Princeton St
- 24 Hinkle Ln
- 426 Argyll Ln
- 55 Payson St
- 8 Stone Bridge Ct
- 10 Stone Bridge Ct
- 608 Claridge Cir Unit 73
- 12 Stone Bridge Ct
- 652 Claridge Cir Unit 96
- 11 Stone Bridge Ct
- 305 Williams Dr
- 1324 Elmhurst Ln
- 530 Morgan Ln
- 937 Shattuck Ln Unit 1281
- 937 Shattuck Ln Unit 937
- 941 Shattuck Ln Unit 1284
- 939 Shattuck Ln Unit 1282
- 931 Shattuck Ln Unit 1272
- 943 Shattuck Ln Unit 1293
- 945 Shattuck Ln Unit 1291
- 947 Shattuck Ln Unit 1292
- 949 Shattuck Ln Unit 1294
- 935 Shattuck Ln Unit 1283
- 933 Shattuck Ln Unit 1274
- 929 Shattuck Ln Unit 1271
- 138 Shattuck Ct Unit 1214
- 138 Shattuck Ct Unit 1212
- 927 Shattuck Ln Unit 1273
- 919 Shattuck Ln Unit 1263
- 132 Shattuck Ct Unit 1213
- 132 Shattuck Ct Unit 132
- 134 Shattuck Ct Unit 1211
- 134 Shattuck Ct Unit 2