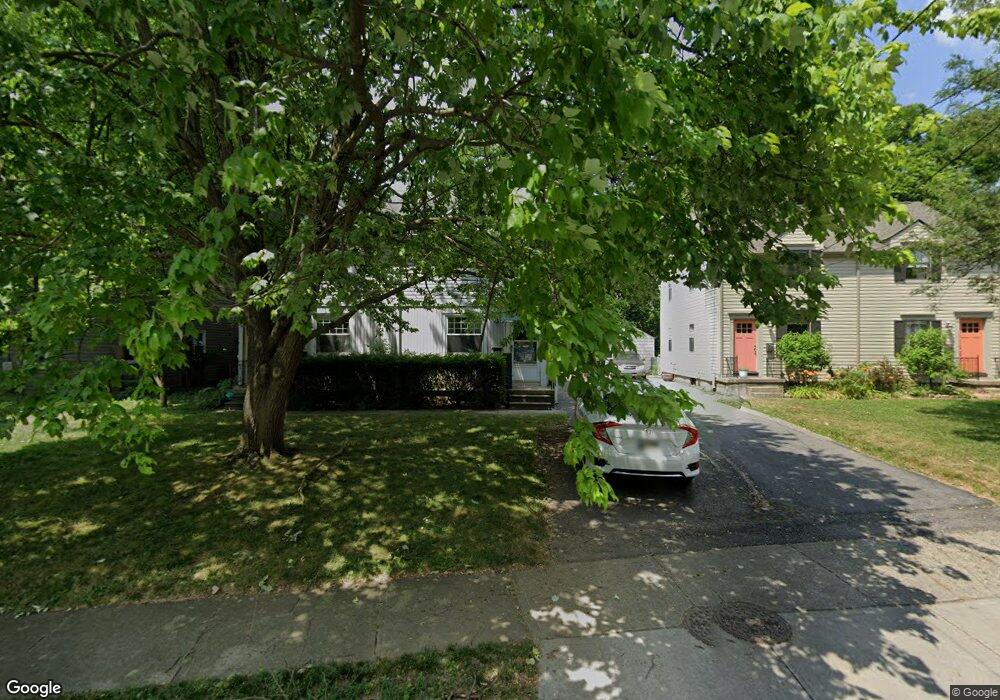
937 Sheridan Ave Unit 939 Columbus, OH 43209
Estimated Value: $287,000 - $319,633
4
Beds
2
Baths
1,904
Sq Ft
$161/Sq Ft
Est. Value
About This Home
This home is located at 937 Sheridan Ave Unit 939, Columbus, OH 43209 and is currently estimated at $306,408, approximately $160 per square foot. 937 Sheridan Ave Unit 939 is a home located in Franklin County with nearby schools including Montrose Elementary School, Bexley Middle School, and Bexley High School.
Ownership History
Date
Name
Owned For
Owner Type
Purchase Details
Closed on
Feb 9, 2023
Sold by
Faulkner Jp
Bought by
937Sheridan Llc
Current Estimated Value
Purchase Details
Closed on
Aug 29, 2016
Sold by
Lantz Janet S
Bought by
Faulkner Jp
Home Financials for this Owner
Home Financials are based on the most recent Mortgage that was taken out on this home.
Original Mortgage
$105,000
Interest Rate
3.42%
Mortgage Type
Future Advance Clause Open End Mortgage
Purchase Details
Closed on
Aug 17, 2016
Sold by
Lantz Janet S
Bought by
Faulkner Jp
Home Financials for this Owner
Home Financials are based on the most recent Mortgage that was taken out on this home.
Original Mortgage
$105,000
Interest Rate
3.42%
Mortgage Type
Future Advance Clause Open End Mortgage
Purchase Details
Closed on
Apr 1, 1994
Bought by
Lantz Neil K and Lantz Janet S
Create a Home Valuation Report for This Property
The Home Valuation Report is an in-depth analysis detailing your home's value as well as a comparison with similar homes in the area
Home Values in the Area
Average Home Value in this Area
Purchase History
| Date | Buyer | Sale Price | Title Company |
|---|---|---|---|
| 937Sheridan Llc | -- | -- | |
| Faulkner Jp | -- | None Available | |
| Faulkner Jp | -- | None Available | |
| Lantz Neil K | -- | -- |
Source: Public Records
Mortgage History
| Date | Status | Borrower | Loan Amount |
|---|---|---|---|
| Previous Owner | Faulkner Jp | $105,000 | |
| Previous Owner | Faulkner Jp | $105,000 |
Source: Public Records
Tax History Compared to Growth
Tax History
| Year | Tax Paid | Tax Assessment Tax Assessment Total Assessment is a certain percentage of the fair market value that is determined by local assessors to be the total taxable value of land and additions on the property. | Land | Improvement |
|---|---|---|---|---|
| 2024 | $4,755 | $84,000 | $24,990 | $59,010 |
| 2023 | $4,284 | $84,000 | $24,990 | $59,010 |
| 2022 | $5,358 | $56,250 | $11,200 | $45,050 |
| 2021 | $3,574 | $56,250 | $11,200 | $45,050 |
| 2020 | $3,543 | $56,250 | $11,200 | $45,050 |
| 2019 | $3,359 | $46,910 | $9,350 | $37,560 |
| 2018 | $2,865 | $46,910 | $9,350 | $37,560 |
| 2017 | $2,863 | $46,910 | $9,350 | $37,560 |
| 2016 | $2,791 | $41,790 | $9,730 | $32,060 |
| 2015 | $2,801 | $41,790 | $9,730 | $32,060 |
| 2014 | $2,817 | $41,790 | $9,730 | $32,060 |
| 2013 | $1,394 | $39,795 | $9,275 | $30,520 |
Source: Public Records
Map
Nearby Homes
- 866-868 Sheridan Ave
- 849 Lyman Ave
- 905 Vernon Rd
- 891 Vernon Rd
- 782 S Remington Rd
- 1052 S Roosevelt Ave
- 1000 S Dawson Ave Unit 302
- 1751 Bide A Wee Park Ave
- 751 Bulen Ave
- 1800 E Fulton St
- 2425 Bryden Rd
- 696 Vernon Rd
- 1656-1658 Forest St
- 2350 Bryden Rd
- 1689 E Kossuth St
- 639 Bulen Ave
- 572 Bulen Ave
- 419 Westland Ave
- 1671-1673 E Whittier St
- 789 Chelsea Ave
- 943-945 Sheridan Ave
- 943 Sheridan Ave Unit 945
- 931 Sheridan Ave Unit 933
- 951 Sheridan Ave
- 940 Ferndale Place
- 923 Sheridan Ave Unit 925
- 934 Ferndale Place
- 948 Ferndale Place
- 926 Ferndale Place
- 959 Sheridan Ave
- 956 Ferndale Place
- 915 Sheridan Ave Unit 917
- 962 Ferndale Place Unit 962
- 920 Ferndale Place
- 928-930 Sheridan Ave
- 936 Sheridan Ave Unit 938
- 928 Sheridan Ave Unit 930
- 928 Sheridan Ave Unit 928-930
- 940 Sheridan Ave
- 963 Sheridan Ave Unit 965