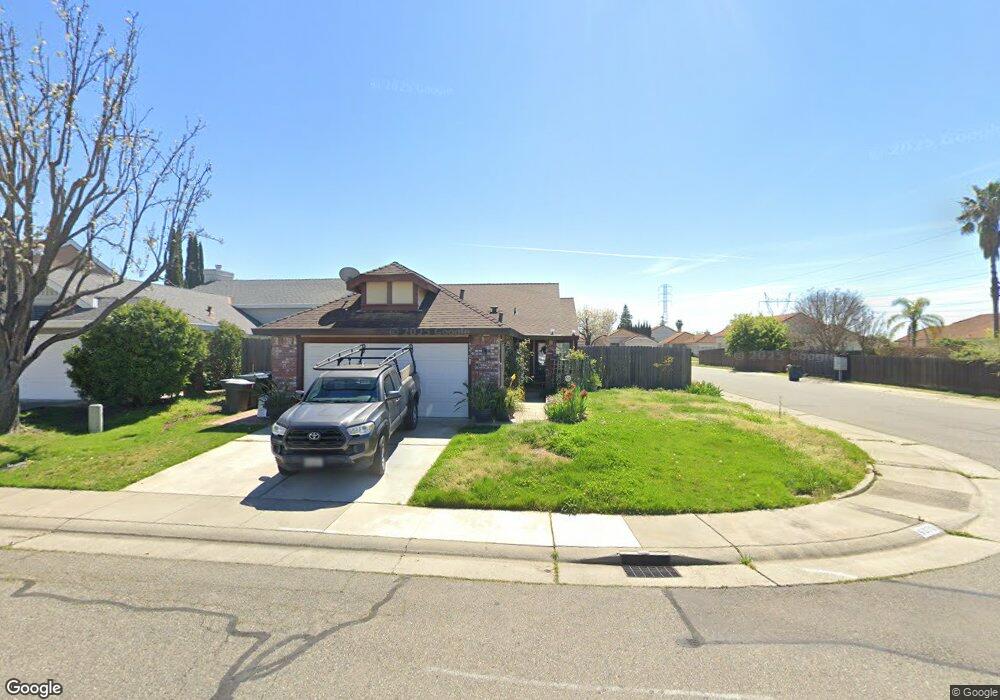
9370 Rampton Ct Sacramento, CA 95829
Estimated Value: $404,000 - $486,000
3
Beds
2
Baths
1,160
Sq Ft
$391/Sq Ft
Est. Value
About This Home
This home is located at 9370 Rampton Ct, Sacramento, CA 95829 and is currently estimated at $453,246, approximately $390 per square foot. 9370 Rampton Ct is a home located in Sacramento County with nearby schools including Robert J. Fite Elementary School, T. R. Smedberg Middle School, and Sheldon High School.
Ownership History
Date
Name
Owned For
Owner Type
Purchase Details
Closed on
Feb 20, 2021
Sold by
Grigg John T
Bought by
Sisavath Sombath
Current Estimated Value
Home Financials for this Owner
Home Financials are based on the most recent Mortgage that was taken out on this home.
Original Mortgage
$334,650
Outstanding Balance
$299,048
Interest Rate
2.65%
Mortgage Type
New Conventional
Estimated Equity
$154,198
Purchase Details
Closed on
Oct 23, 2002
Sold by
Brown Daren M and Brown Melodie
Bought by
Grigg John T
Home Financials for this Owner
Home Financials are based on the most recent Mortgage that was taken out on this home.
Original Mortgage
$199,186
Interest Rate
5.99%
Mortgage Type
FHA
Purchase Details
Closed on
Feb 22, 1999
Sold by
Dean Patricia A
Bought by
Brown Daren M and Brown Melodie
Home Financials for this Owner
Home Financials are based on the most recent Mortgage that was taken out on this home.
Original Mortgage
$119,160
Interest Rate
6.78%
Mortgage Type
FHA
Create a Home Valuation Report for This Property
The Home Valuation Report is an in-depth analysis detailing your home's value as well as a comparison with similar homes in the area
Home Values in the Area
Average Home Value in this Area
Purchase History
| Date | Buyer | Sale Price | Title Company |
|---|---|---|---|
| Sisavath Sombath | $345,000 | Placer Title Company | |
| Grigg John T | -- | Placer Title Company | |
| Grigg John T | $202,000 | North American Title Company | |
| Brown Daren M | $120,000 | Financial Title Company |
Source: Public Records
Mortgage History
| Date | Status | Borrower | Loan Amount |
|---|---|---|---|
| Open | Grigg John T | $334,650 | |
| Previous Owner | Grigg John T | $199,186 | |
| Previous Owner | Brown Daren M | $119,160 |
Source: Public Records
Tax History Compared to Growth
Tax History
| Year | Tax Paid | Tax Assessment Tax Assessment Total Assessment is a certain percentage of the fair market value that is determined by local assessors to be the total taxable value of land and additions on the property. | Land | Improvement |
|---|---|---|---|---|
| 2025 | $4,679 | $494,190 | $145,656 | $348,534 |
| 2024 | $4,679 | $424,483 | $148,569 | $275,914 |
| 2023 | $4,562 | $416,160 | $145,656 | $270,504 |
| 2022 | $4,484 | $408,000 | $142,800 | $265,200 |
| 2021 | $3,131 | $270,267 | $60,204 | $210,063 |
| 2020 | $3,090 | $267,497 | $59,587 | $207,910 |
| 2019 | $3,037 | $262,253 | $58,419 | $203,834 |
| 2018 | $2,958 | $257,112 | $57,274 | $199,838 |
| 2017 | $2,909 | $252,071 | $56,151 | $195,920 |
| 2016 | $2,768 | $247,129 | $55,050 | $192,079 |
| 2015 | $2,718 | $243,418 | $54,224 | $189,194 |
| 2014 | $2,675 | $238,650 | $53,162 | $185,488 |
Source: Public Records
Map
Nearby Homes
- 9343 Boscastle Way
- 9363 Boscastle Way
- 8174 Finmere Way
- 8216 Rivallo Way
- 9287 Benefield Ct
- 8298 Courage Dr
- 9273 Amarone Way
- 9244 Brevard Ct
- 9172 Durness Way
- 8210 Scrimshaw Way
- 8294 Courage Dr
- 7920 Kelvedon Way
- 9169 Garlington Ct
- 7984 Munhall Ct
- 8054 Boeger Ct
- 9209 Rosecut Ct
- 9040 Durness Way
- 9279 Prudhoe Ct
- 9401 Rogers Rd
- 7929 Symington Way
- 9374 Rampton Ct
- 8137 Carsington Way
- 9358 Dartford Ct
- 9378 Rampton Ct
- 8141 Carsington Way
- 8125 Carsington Way
- 9382 Rampton Ct
- 9354 Dartford Ct
- 9359 Washford Ct
- 8145 Carsington Way
- 9381 Morcott Way
- 9355 Washford Ct
- 9377 Rampton Ct
- 9359 Dartford Ct
- 9386 Rampton Ct
- 8121 Carsington Way
- 9350 Dartford Ct
- 9385 Morcott Way
- 9383 Rampton Ct
- 9351 Washford Ct