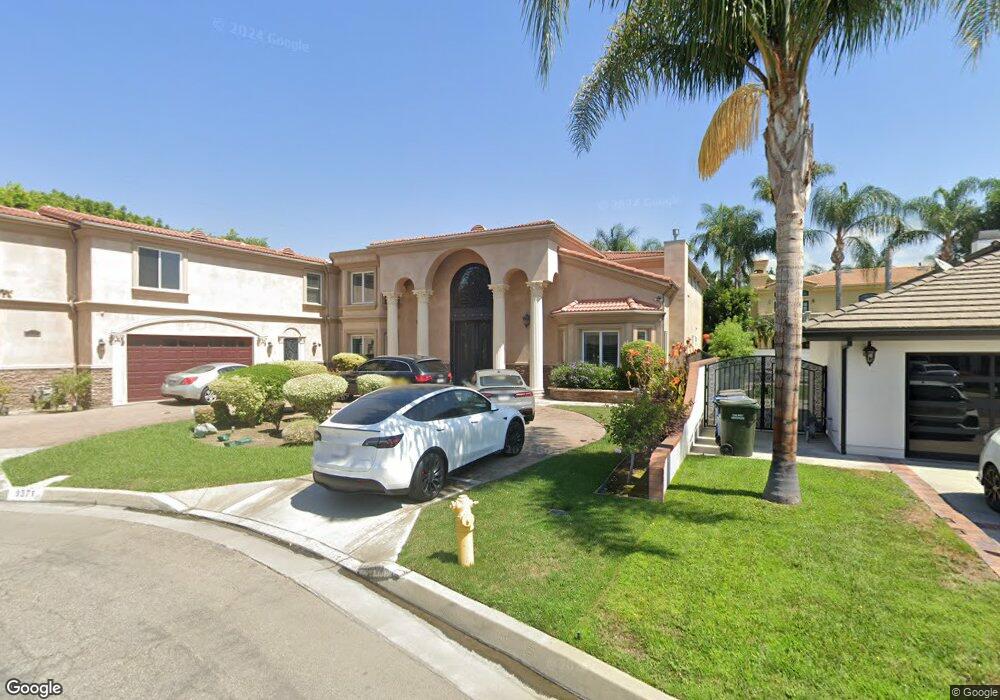
9371 Suva St Downey, CA 90240
Estimated Value: $2,110,000 - $2,708,533
5
Beds
7
Baths
6,359
Sq Ft
$378/Sq Ft
Est. Value
About This Home
This home is located at 9371 Suva St, Downey, CA 90240 and is currently estimated at $2,402,633, approximately $377 per square foot. 9371 Suva St is a home with nearby schools including Rio San Gabriel Elementary School, Doty Middle School, and Downey High School.
Ownership History
Date
Name
Owned For
Owner Type
Purchase Details
Closed on
Jan 12, 2011
Sold by
Patel Narandra H
Bought by
Patel Niranjana N
Current Estimated Value
Purchase Details
Closed on
Oct 18, 2010
Sold by
Patel Narandra H and Patel Niranjana N
Bought by
Patel Narandra H
Purchase Details
Closed on
Jul 22, 2009
Sold by
Patel Narandra and Patel Niranjana N
Bought by
Patel Narandra H and Patel Niranjana N
Purchase Details
Closed on
May 14, 2007
Sold by
Patel Godavariben Harkisonbhai and The Patel Family
Bought by
Patel Narandra and Patel Niranjana N
Home Financials for this Owner
Home Financials are based on the most recent Mortgage that was taken out on this home.
Original Mortgage
$1,300,000
Interest Rate
6.57%
Mortgage Type
Construction
Create a Home Valuation Report for This Property
The Home Valuation Report is an in-depth analysis detailing your home's value as well as a comparison with similar homes in the area
Home Values in the Area
Average Home Value in this Area
Purchase History
| Date | Buyer | Sale Price | Title Company |
|---|---|---|---|
| Patel Niranjana N | -- | None Available | |
| Patel Narandra H | -- | None Available | |
| Patel Narandra H | -- | None Available | |
| Patel Narandra | -- | Ticor Title Company |
Source: Public Records
Mortgage History
| Date | Status | Borrower | Loan Amount |
|---|---|---|---|
| Previous Owner | Patel Narandra | $1,300,000 |
Source: Public Records
Tax History Compared to Growth
Tax History
| Year | Tax Paid | Tax Assessment Tax Assessment Total Assessment is a certain percentage of the fair market value that is determined by local assessors to be the total taxable value of land and additions on the property. | Land | Improvement |
|---|---|---|---|---|
| 2025 | $22,859 | $1,830,552 | $634,721 | $1,195,831 |
| 2024 | $22,435 | $1,794,660 | $622,276 | $1,172,384 |
| 2023 | $21,660 | $1,759,472 | $610,075 | $1,149,397 |
| 2022 | $20,558 | $1,724,973 | $598,113 | $1,126,860 |
| 2021 | $20,148 | $1,691,151 | $586,386 | $1,104,765 |
| 2020 | $19,835 | $1,673,811 | $580,374 | $1,093,437 |
| 2019 | $19,603 | $1,640,993 | $568,995 | $1,071,998 |
| 2018 | $19,113 | $1,608,818 | $557,839 | $1,050,979 |
| 2016 | $18,267 | $1,546,347 | $536,178 | $1,010,169 |
| 2015 | $18,010 | $1,523,121 | $528,125 | $994,996 |
| 2014 | $16,934 | $1,493,286 | $517,780 | $975,506 |
Source: Public Records
Map
Nearby Homes
- 9378 Suva St
- 9433 Dacosta St
- 9363 Dinsdale St
- 9123 Lemoran Ave
- 9135 Cord Ave
- 10233 Cord Ave
- 9623 Shellyfield Rd
- 9203 Chaney Ave
- 9720 Blandwood Rd
- 10040 Mattock Ave
- 9069 Gallatin Rd
- 9326 Via Amorita
- 10307 Haledon Ave
- 9504 Telegraph Rd
- 8620 Lubec St
- 11032 Davenrich St
- 9044 Bigby St
- 8901 Serapis Ave Unit 26
- 9017 Arrington Ave
- 9311 Claymore St
- 9375 Suva St
- 9368 Raviller Dr
- 9700 Garnish Dr
- 9712 Garnish Dr
- 9376 Raviller Dr
- 9644 Garnish Dr
- 9383 Suva St
- 9362 Suva St
- 9304 Raviller Dr
- 9724 Garnish Dr
- 9368 Suva St
- 9320 Raviller Dr
- 9630 Garnish Dr
- 9386 Raviller Dr
- 9391 Suva St
- 9374 Suva St
- 9734 Garnish Dr
- 9303 Raviller Dr
- 9319 Raviller Dr
- 9620 Garnish Dr