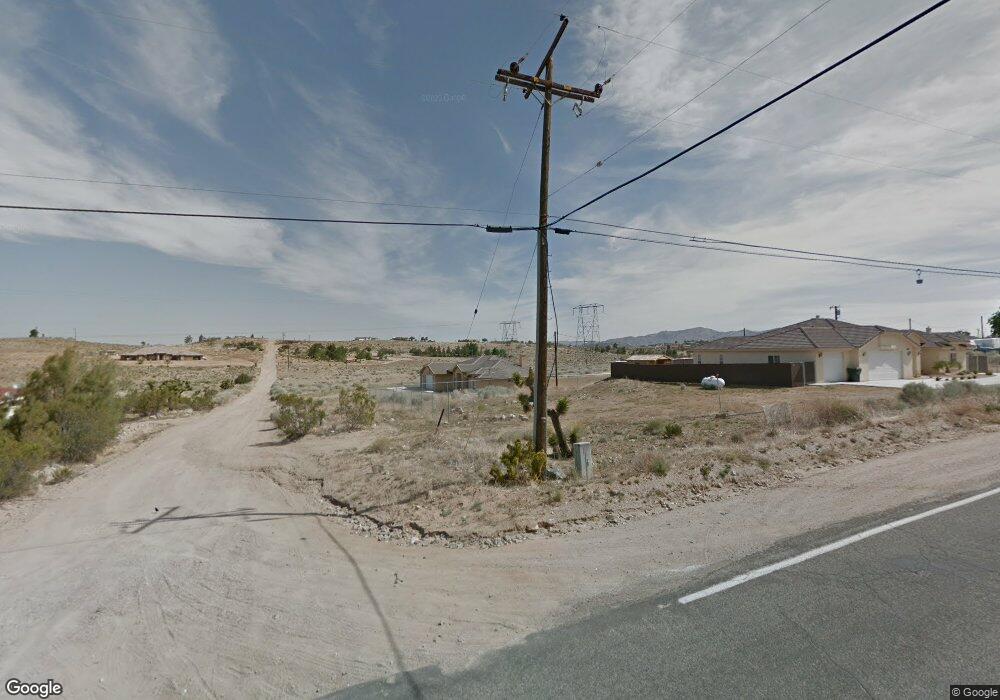
9375 Mesa Vista St Apple Valley, CA 92308
High Desert NeighborhoodEstimated Value: $478,000 - $544,000
4
Beds
3
Baths
2,286
Sq Ft
$226/Sq Ft
Est. Value
About This Home
This home is located at 9375 Mesa Vista St, Apple Valley, CA 92308 and is currently estimated at $517,123, approximately $226 per square foot. 9375 Mesa Vista St is a home located in San Bernardino County with nearby schools including Mariana Academy and Apple Valley High School.
Ownership History
Date
Name
Owned For
Owner Type
Purchase Details
Closed on
Sep 10, 2009
Sold by
National Credit Union
Bought by
Belcher Jason M
Current Estimated Value
Home Financials for this Owner
Home Financials are based on the most recent Mortgage that was taken out on this home.
Original Mortgage
$181,649
Interest Rate
4.88%
Mortgage Type
FHA
Purchase Details
Closed on
May 22, 2009
Sold by
Lucero Tiana V
Bought by
High Desert Federal Credit Union
Purchase Details
Closed on
Jun 6, 2008
Sold by
Lucero Tiana V
Bought by
Assured Funding Corp Services Inc
Purchase Details
Closed on
Aug 29, 2006
Sold by
Ward Mark C
Bought by
Lucero Tiana V
Purchase Details
Closed on
Jun 14, 2005
Sold by
Ward Donna W
Bought by
Ward Mark C and The Mark Craig Ward Living Tru
Purchase Details
Closed on
Dec 31, 2000
Sold by
Ward Donna W
Bought by
Ward Mark C and The Mark Craig Ward Living Tru
Purchase Details
Closed on
Feb 10, 1996
Sold by
Ward Mark C
Bought by
Ward Donna W and The Donna W Ward Trust
Create a Home Valuation Report for This Property
The Home Valuation Report is an in-depth analysis detailing your home's value as well as a comparison with similar homes in the area
Home Values in the Area
Average Home Value in this Area
Purchase History
| Date | Buyer | Sale Price | Title Company |
|---|---|---|---|
| Belcher Jason M | $185,000 | First American Title Company | |
| High Desert Federal Credit Union | $329,802 | None Available | |
| Assured Funding Corp Services Inc | $91,000 | Accommodation | |
| Lucero Tiana V | $90,000 | Stewart Title Company | |
| Ward Mark C | $75,000 | Fidelity National Title Co | |
| Ward Mark C | -- | -- | |
| Ward Donna W | -- | -- |
Source: Public Records
Mortgage History
| Date | Status | Borrower | Loan Amount |
|---|---|---|---|
| Previous Owner | Belcher Jason M | $181,649 |
Source: Public Records
Tax History
| Year | Tax Paid | Tax Assessment Tax Assessment Total Assessment is a certain percentage of the fair market value that is determined by local assessors to be the total taxable value of land and additions on the property. | Land | Improvement |
|---|---|---|---|---|
| 2025 | $2,872 | $238,803 | $38,725 | $200,078 |
| 2024 | $2,793 | $234,121 | $37,966 | $196,155 |
| 2023 | $2,768 | $229,531 | $37,222 | $192,309 |
| 2022 | $2,726 | $225,030 | $36,492 | $188,538 |
| 2021 | $2,660 | $220,617 | $35,776 | $184,841 |
| 2020 | $2,629 | $218,355 | $35,409 | $182,946 |
| 2019 | $2,587 | $214,074 | $34,715 | $179,359 |
| 2018 | $2,525 | $209,876 | $34,034 | $175,842 |
| 2017 | $2,491 | $205,761 | $33,367 | $172,394 |
| 2016 | $2,391 | $201,727 | $32,713 | $169,014 |
| 2015 | $2,357 | $198,697 | $32,222 | $166,475 |
| 2014 | $2,326 | $194,805 | $31,591 | $163,214 |
Source: Public Records
Map
Nearby Homes
- 22227 Skyline Dr
- 9230 Allegra Vista St
- 9075 Mesa Vista St
- 9226 Central Rd
- 21972 Ocotillo Way
- 0 Hercules St Unit HD25164179
- 22585 Ocotillo Way
- 0 Moonbeam Trail Unit SW26025295
- 0 Joshua St Unit HD25197152
- 11 Juniper St
- 9585 Juniper St
- 2 Joshua St
- 9632 Juniper St
- 9878 Bella Vista St
- 23053 Roundup Way
- 0 Ocotillo Way Unit HD25030448
- 0 Ocotillo Way Unit HD25272582
- 0 Ocotillo Way Unit 26462368
- 0 Ocotillo Way Unit OC25115091
- 172062 Poppy Rd
- 22140 Roundup Way
- 22050 Roundup Way
- 9382 Buckbrush Rd
- 22150 Roundup Way
- 22145 Roundup Way
- 9276 Mesa Vista St
- 22030 Roundup Way
- 22230 Roundup Way
- 9285 Mesa Vista St
- 22027 Roundup Way
- 22212 Skyline Dr
- 22215 Skyline Dr
- 9224 Mesa Vista St
- 9229 Mesa Vista St
- 22224 Skyline Dr
- 9370 Buena Vista St
- 9466 Mesa Vista St
- 9435 Mesa Vista St
- 9479 Buena Vista St Unit ST
- 9479 Buena Vista St
Your Personal Tour Guide
Ask me questions while you tour the home.