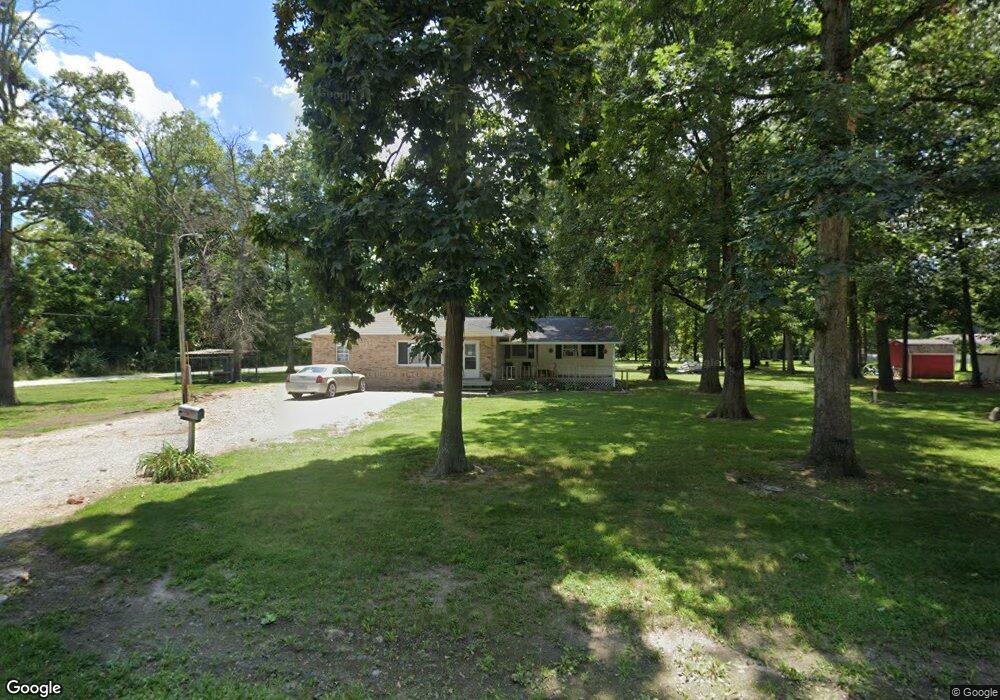
9378 E Nees Ave Effingham, IL 62401
Estimated Value: $194,000 - $583,000
4
Beds
--
Bath
1,776
Sq Ft
$192/Sq Ft
Est. Value
About This Home
This home is located at 9378 E Nees Ave, Effingham, IL 62401 and is currently estimated at $341,204, approximately $192 per square foot. 9378 E Nees Ave is a home located in Effingham County with nearby schools including South Side Grade School, Early Learning Center, and Central Grade School.
Ownership History
Date
Name
Owned For
Owner Type
Purchase Details
Closed on
Sep 10, 2019
Sold by
Koester Eric D and Koester Laura L
Bought by
Kirby Jody
Current Estimated Value
Home Financials for this Owner
Home Financials are based on the most recent Mortgage that was taken out on this home.
Original Mortgage
$122,000
Interest Rate
3.7%
Purchase Details
Closed on
Jun 22, 2009
Sold by
Freepartner Christopher P and Freepartner Sheila A
Bought by
Koester Eric D and Koester Laura L
Home Financials for this Owner
Home Financials are based on the most recent Mortgage that was taken out on this home.
Original Mortgage
$128,720
Interest Rate
4.86%
Mortgage Type
New Conventional
Purchase Details
Closed on
Aug 2, 2007
Sold by
Lovel Len B and Lovel Deborah V
Bought by
Freepartner Christopher P and Freepartner Sheila A
Create a Home Valuation Report for This Property
The Home Valuation Report is an in-depth analysis detailing your home's value as well as a comparison with similar homes in the area
Purchase History
| Date | Buyer | Sale Price | Title Company |
|---|---|---|---|
| Kirby Jody | $120,000 | Citywide Title Corporation | |
| Koester Eric D | $124,500 | None Available | |
| Freepartner Christopher P | $119,000 | None Available |
Source: Public Records
Mortgage History
| Date | Status | Borrower | Loan Amount |
|---|---|---|---|
| Closed | Kirby Jody | $122,000 | |
| Previous Owner | Koester Eric D | $128,720 |
Source: Public Records
Tax History
| Year | Tax Paid | Tax Assessment Tax Assessment Total Assessment is a certain percentage of the fair market value that is determined by local assessors to be the total taxable value of land and additions on the property. | Land | Improvement |
|---|---|---|---|---|
| 2024 | $3,214 | $66,040 | $5,090 | $60,950 |
| 2023 | $2,892 | $59,770 | $4,610 | $55,160 |
| 2022 | $2,712 | $55,340 | $4,270 | $51,070 |
| 2021 | $2,583 | $52,710 | $4,070 | $48,640 |
| 2020 | $2,481 | $50,680 | $3,910 | $46,770 |
| 2019 | $2,399 | $49,210 | $3,800 | $45,410 |
| 2018 | $2,289 | $46,870 | $3,620 | $43,250 |
| 2017 | $2,252 | $45,950 | $3,550 | $42,400 |
| 2016 | $2,163 | $43,970 | $3,400 | $40,570 |
| 2015 | -- | $43,540 | $3,370 | $40,170 |
| 2014 | -- | $43,110 | $3,340 | $39,770 |
| 2013 | -- | $43,110 | $3,340 | $39,770 |
| 2012 | -- | $43,110 | $3,340 | $39,770 |
Source: Public Records
Map
Nearby Homes
- 9284 E Court 11
- 9219 E Best Ct
- 14748 N Court 7
- 14689 N Court 6
- 14704 N Court 1
- 14744 N Court 1
- 15872 N Bluebird Dr
- 15243 N Holden Ave
- 15482 N Wildwood Dr
- 15981 N Hillcrest Dr
- 11107 E Cambridge Ln
- 11020 E Lake Edward Ln
- 11154 E Ravenwood Ct
- 11284 E Lincolnshire Ln
- 24 N Country Club Rd
- 16852 Willow Ridge Dr
- 21 N Country Club Rd
- 13120 Augusta National Dr
- 9 N Country Club Rd
- 8 N Country Club Rd
- 9384 E Nees Ave
- 13428 Augusta National Dr
- 15096 N Nees Ln
- 9368 Nees Ave
- 9374 E Nees Ave
- 9362 E Nees Ave
- 0 Siemer Rd Unit 9557634
- 0 Siemer Rd Unit MRD11494087
- 0 Siemer Rd Unit MRD11546052
- 0 Siemer Rd Unit MRD11550088
- 0 Siemer Rd Unit MRD11546153
- 0 Siemer Rd Unit MRD11545547
- 0 Siemer Rd Unit MRD11549921
- 0 Siemer Rd Unit MRD11544425
- 0 Siemer Rd Unit MRD11548439
- 0 Siemer Rd Unit 6212338
- 9387 E Nees Ave
- 9365 Nees Ave
- 15061 N Nees Ln
- 9356 E Nees Ave
Your Personal Tour Guide
Ask me questions while you tour the home.