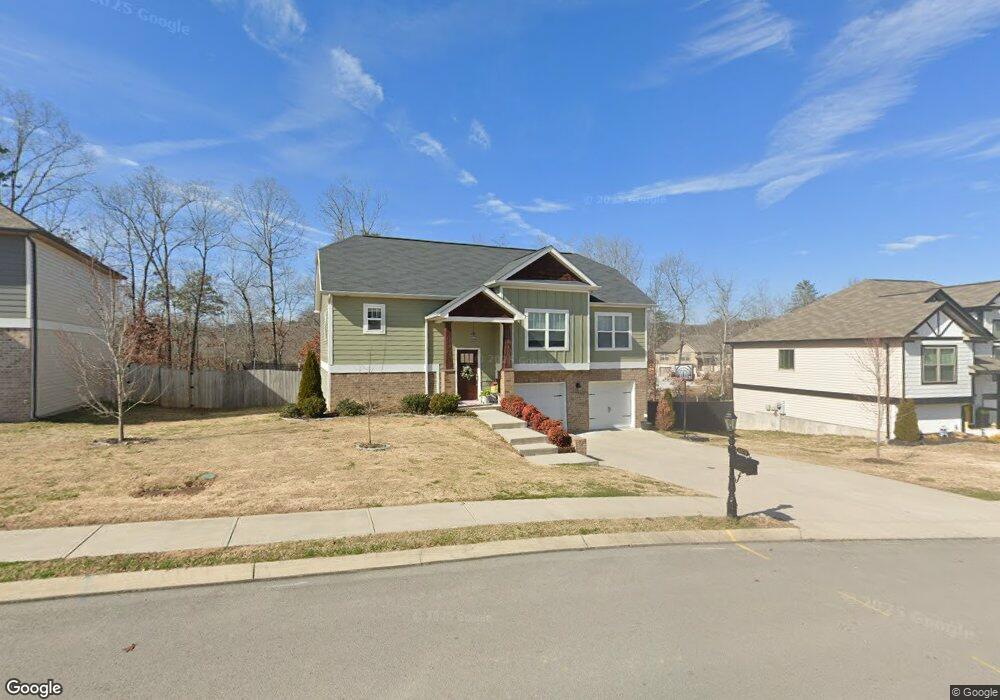
9379 Chirping Rd Unit Lot No. 206 Hixson, TN 37343
Estimated Value: $428,000 - $441,000
--
Bed
3
Baths
2,011
Sq Ft
$215/Sq Ft
Est. Value
About This Home
This home is located at 9379 Chirping Rd Unit Lot No. 206, Hixson, TN 37343 and is currently estimated at $432,562, approximately $215 per square foot. 9379 Chirping Rd Unit Lot No. 206 is a home located in Hamilton County.
Ownership History
Date
Name
Owned For
Owner Type
Purchase Details
Closed on
Mar 23, 2023
Sold by
Heard Johnathan C and Heard Jessica
Bought by
Dragoo Tyler Chase and Dragoo Emily Addison
Current Estimated Value
Home Financials for this Owner
Home Financials are based on the most recent Mortgage that was taken out on this home.
Original Mortgage
$256,000
Outstanding Balance
$247,949
Interest Rate
6.12%
Mortgage Type
New Conventional
Estimated Equity
$184,613
Purchase Details
Closed on
Dec 1, 2022
Sold by
Agee Kerry Doherty
Bought by
Heard Johnathan C and Heard Jessica
Home Financials for this Owner
Home Financials are based on the most recent Mortgage that was taken out on this home.
Original Mortgage
$325,600
Interest Rate
6.95%
Mortgage Type
FHA
Purchase Details
Closed on
Jul 15, 2019
Sold by
Tidewater Properties Llc
Bought by
Doherty Agee Kerry
Home Financials for this Owner
Home Financials are based on the most recent Mortgage that was taken out on this home.
Original Mortgage
$265,109
Interest Rate
3.62%
Mortgage Type
FHA
Create a Home Valuation Report for This Property
The Home Valuation Report is an in-depth analysis detailing your home's value as well as a comparison with similar homes in the area
Home Values in the Area
Average Home Value in this Area
Purchase History
| Date | Buyer | Sale Price | Title Company |
|---|---|---|---|
| Dragoo Tyler Chase | $396,000 | Hon & Kopet Title | |
| Heard Johnathan C | $390,000 | Realty Center Title | |
| Doherty Agee Kerry | $270,000 | Jones Title Insurance Agency |
Source: Public Records
Mortgage History
| Date | Status | Borrower | Loan Amount |
|---|---|---|---|
| Open | Dragoo Tyler Chase | $256,000 | |
| Previous Owner | Heard Johnathan C | $325,600 | |
| Previous Owner | Doherty Agee Kerry | $265,109 |
Source: Public Records
Tax History Compared to Growth
Tax History
| Year | Tax Paid | Tax Assessment Tax Assessment Total Assessment is a certain percentage of the fair market value that is determined by local assessors to be the total taxable value of land and additions on the property. | Land | Improvement |
|---|---|---|---|---|
| 2024 | $1,548 | $69,200 | $0 | $0 |
| 2023 | $1,557 | $69,200 | $0 | $0 |
| 2022 | $1,557 | $69,200 | $0 | $0 |
| 2021 | $1,557 | $69,200 | $0 | $0 |
| 2020 | $1,705 | $30,700 | $0 | $0 |
| 2019 | $858 | $12,500 | $0 | $0 |
| 2018 | $0 | $0 | $0 | $0 |
Source: Public Records
Map
Nearby Homes
- 9378 Chirping Rd
- 9322 Fremont Way
- Hunter Plan at Sedman Hills
- Hamilton Plan at Sedman Hills
- Yosemite Plan at Sedman Hills
- Arlington Plan at Sedman Hills
- River Plan at Sedman Hills
- Downing Plan at Sedman Hills
- Oxford Plan at Sedman Hills
- Camden Plan at Sedman Hills
- Beckham Plan at Sedman Hills
- Redwood Plan at Sedman Hills
- 318 Fox Gap Ln
- 9111 Beranke Ln
- 9080 Wood Dale Ln
- 8549 Demars Ln
- 9226 Sugar Pine Dr
- 9400 W Ridge Trail Rd
- 1013 Kenny Way
- 1442 Alex Ln
- 9393 Chirping Rd
- 9389 Chirping Rd
- 9383 Chirping Rd
- 9393 Chirping Rd Unit 209
- 9389 Chirping Rd Unit Lot No. 208
- 9379 Chirping Rd
- 9392 Chirping Rd
- 9382 Chirping Rd
- 9386 Chirping Rd
- 9378 Chirping Rd Unit 297
- 9382 Chirping Rd Unit 296
- 9392 Chirping Rd Unit 294
- 9386 Chirping Rd Unit Lot No. 295
- 9348 Chirping Rd
- 9348 Chirping Rd Unit 151
- 9342 Chirping Rd
- 9342 Chirping Rd Unit 150
- 9354 Chirping Rd
- 9354 Chirping Rd Unit 152
- 9347 Chirping Rd