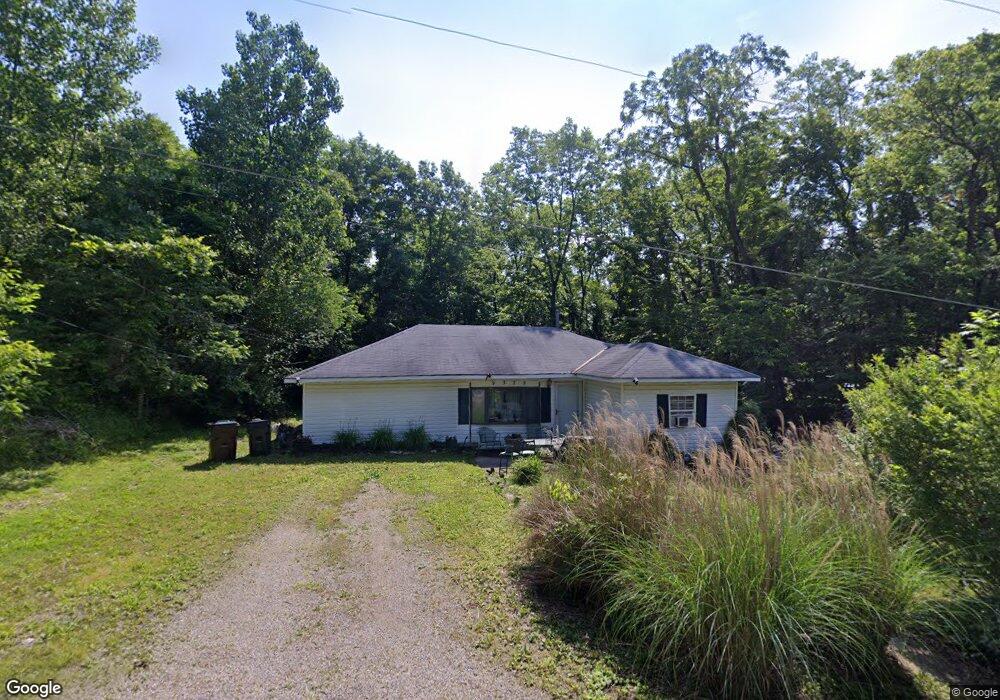
9379 Myrna Dr S Powell, OH 43065
Concord NeighborhoodEstimated Value: $187,828 - $404,000
3
Beds
1
Bath
1,080
Sq Ft
$294/Sq Ft
Est. Value
About This Home
This home is located at 9379 Myrna Dr S, Powell, OH 43065 and is currently estimated at $317,457, approximately $293 per square foot. 9379 Myrna Dr S is a home located in Delaware County with nearby schools including Eli Pinney Elementary School, Willard Grizzell Middle School, and Dublin Jerome High School.
Ownership History
Date
Name
Owned For
Owner Type
Purchase Details
Closed on
Feb 22, 2010
Sold by
Smith Denise E and Smith Ralph
Bought by
Bohanan Michael L
Current Estimated Value
Purchase Details
Closed on
Feb 20, 2010
Sold by
Hill Diane L and Hill Howard A
Bought by
Bohanan Michael L
Purchase Details
Closed on
Feb 18, 2010
Sold by
Estate Of Christine Marcella Bohanan
Bought by
Paige Anthony Curtis and Sow Annette
Purchase Details
Closed on
Feb 12, 2010
Sold by
Paige Anthony C and Paige Mary V
Bought by
Bohanan Michael L
Purchase Details
Closed on
Feb 8, 2010
Sold by
Bohanan Willie Eugene
Bought by
Bohanan Michael L
Purchase Details
Closed on
Feb 4, 2010
Sold by
Morris Robert Eugene
Bought by
Bohanan Michael L
Purchase Details
Closed on
Apr 13, 2007
Sold by
Bohonan Albert
Bought by
Bohanan Christine
Create a Home Valuation Report for This Property
The Home Valuation Report is an in-depth analysis detailing your home's value as well as a comparison with similar homes in the area
Home Values in the Area
Average Home Value in this Area
Purchase History
| Date | Buyer | Sale Price | Title Company |
|---|---|---|---|
| Bohanan Michael L | -- | Attorney | |
| Bohanan Michael L | -- | Attorney | |
| Bohanan Michael L | -- | Attorney | |
| Paige Anthony Curtis | -- | None Available | |
| Bohanan Michael L | -- | Attorney | |
| Bohanan Michael L | -- | Attorney | |
| Bohanan Michael L | -- | Attorney | |
| Bohanan Christine | -- | None Available |
Source: Public Records
Tax History Compared to Growth
Tax History
| Year | Tax Paid | Tax Assessment Tax Assessment Total Assessment is a certain percentage of the fair market value that is determined by local assessors to be the total taxable value of land and additions on the property. | Land | Improvement |
|---|---|---|---|---|
| 2024 | $2,004 | $35,700 | $4,480 | $31,220 |
| 2023 | $1,995 | $35,700 | $4,480 | $31,220 |
| 2022 | $1,456 | $24,290 | $4,060 | $20,230 |
| 2021 | $1,480 | $24,290 | $4,060 | $20,230 |
| 2020 | $1,486 | $24,290 | $4,060 | $20,230 |
| 2019 | $1,612 | $23,490 | $3,260 | $20,230 |
| 2018 | $1,628 | $23,490 | $3,260 | $20,230 |
| 2017 | $1,446 | $21,420 | $2,590 | $18,830 |
| 2016 | $1,426 | $21,420 | $2,590 | $18,830 |
| 2015 | $1,420 | $21,420 | $2,590 | $18,830 |
| 2014 | $1,435 | $21,420 | $2,590 | $18,830 |
| 2013 | $1,407 | $20,510 | $2,590 | $17,920 |
Source: Public Records
Map
Nearby Homes
- 6512 Harriott Rd
- 0 N Park Place W Unit 225035823
- 60 Buckeye Dr
- 0 Sunset Dr
- 0 Dublin Rd Unit 225011118
- 5681 Morlich Square
- 5640 Morlich Square
- 9398 Culross Ct
- 5690 Duddingston Dr
- 9190 Leith Dr
- 9280 Leith Dr
- Verona Plan at The Courtyards on Concord
- Torino Plan at The Courtyards on Concord
- Provenance Plan at The Courtyards on Concord
- Promenade Plan at The Courtyards on Concord
- 0 Glick Rd Unit 225037914
- 9149 Turfway Bend Dr
- 8390 Whisper Trace
- 5515 Aryshire Ct Unit 23
- 10007 Allen Dr
- 9362 Gwendolyn Dr
- 6460 Harriott Rd
- 9324 Gwendolyn Dr
- 9381 Gwendolyn Dr
- 0 Gwendolyn Dr Unit 2706988
- 0 Gwendolyn Dr Unit 36449
- 0 Gwendolyn Dr Unit 24329
- 0 Gwendolyn Dr Unit 9904260
- 0 Gwendolyn Dr Unit Lot 595 211009345
- 0 Gwendolyn Dr
- 9343 Gwendolyn Dr
- 6580 Harriott Rd
- 9312 Gwendolyn Dr
- 9430 Myrna Dr
- 9336 Springdale Dr
- 6570 Raynor Ct
- 6582 Raynor Ct
- 6381 Harriott Rd
- 6602 Raynor Ct
- 0 Myrna Dr S Unit L365 2125162