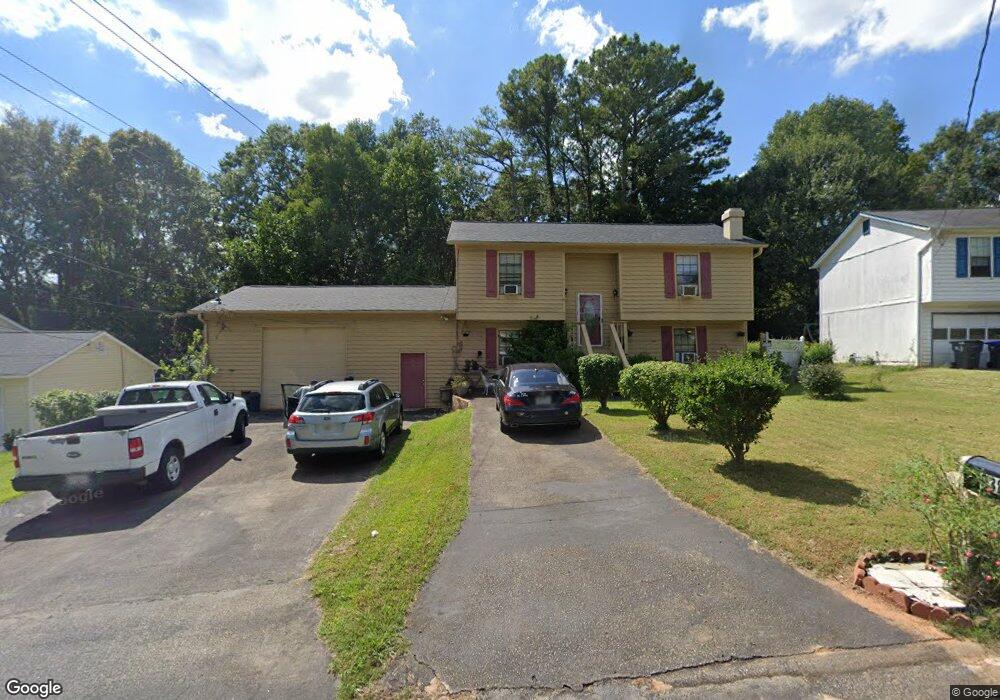
938 Clover Ln Lawrenceville, GA 30044
Estimated Value: $340,000 - $354,000
3
Beds
2
Baths
898
Sq Ft
$385/Sq Ft
Est. Value
About This Home
This home is located at 938 Clover Ln, Lawrenceville, GA 30044 and is currently estimated at $345,592, approximately $384 per square foot. 938 Clover Ln is a home located in Gwinnett County with nearby schools including Bethesda Elementary School, Sweetwater Middle School, and Berkmar High School.
Ownership History
Date
Name
Owned For
Owner Type
Purchase Details
Closed on
Feb 11, 2021
Sold by
Khanum Ferzana
Bought by
Khanum Ferzana and Khanum Talat Mahmood
Current Estimated Value
Purchase Details
Closed on
Jun 24, 2020
Sold by
Khanum Farzana
Bought by
Mahmood Talat and Khanum Ferzana
Purchase Details
Closed on
Jun 24, 2011
Sold by
Iqbal Javed
Bought by
Khanum Farzana
Purchase Details
Closed on
Dec 10, 2010
Sold by
Gsamp Trust 2002-He
Bought by
Iqbal Javed
Purchase Details
Closed on
Feb 2, 2010
Sold by
Stewart Frankie C
Bought by
Gsamp Trust 2002-He
Purchase Details
Closed on
Sep 25, 2000
Sold by
Stewart Frankie C and Stewart Debi C
Bought by
Stewart Frankie C
Home Financials for this Owner
Home Financials are based on the most recent Mortgage that was taken out on this home.
Original Mortgage
$110,047
Interest Rate
7.97%
Mortgage Type
Credit Line Revolving
Create a Home Valuation Report for This Property
The Home Valuation Report is an in-depth analysis detailing your home's value as well as a comparison with similar homes in the area
Home Values in the Area
Average Home Value in this Area
Purchase History
| Date | Buyer | Sale Price | Title Company |
|---|---|---|---|
| Khanum Ferzana | -- | -- | |
| Mahmood Talat | -- | -- | |
| Khanum Farzana | -- | -- | |
| Iqbal Javed | $44,700 | -- | |
| Gsamp Trust 2002-He | $105,000 | -- | |
| Stewart Frankie C | -- | -- |
Source: Public Records
Mortgage History
| Date | Status | Borrower | Loan Amount |
|---|---|---|---|
| Previous Owner | Stewart Frankie C | $110,047 |
Source: Public Records
Tax History Compared to Growth
Tax History
| Year | Tax Paid | Tax Assessment Tax Assessment Total Assessment is a certain percentage of the fair market value that is determined by local assessors to be the total taxable value of land and additions on the property. | Land | Improvement |
|---|---|---|---|---|
| 2025 | -- | $127,920 | $21,120 | $106,800 |
| 2024 | -- | $121,160 | $21,120 | $100,040 |
| 2023 | $388 | $118,520 | $24,000 | $94,520 |
| 2022 | $0 | $91,120 | $20,000 | $71,120 |
| 2021 | $1,806 | $66,680 | $14,280 | $52,400 |
| 2020 | $1,820 | $66,680 | $14,280 | $52,400 |
| 2019 | $1,802 | $66,680 | $14,280 | $52,400 |
| 2018 | $1,589 | $56,960 | $10,880 | $46,080 |
| 2016 | $1,270 | $41,080 | $9,600 | $31,480 |
| 2015 | $1,091 | $33,000 | $6,800 | $26,200 |
| 2014 | $1,094 | $33,000 | $6,800 | $26,200 |
Source: Public Records
Map
Nearby Homes
- 971 Clover Ln
- 3002 Cruse Rd
- 3062 Ferrite Loop
- 1020 Hampton Hill Ct
- 1141 Vintage Pointe Dr
- 3200 Colgan Trace Unit 2
- 877 Dunlin Fields Dr
- 1151 Holly Cir
- 1124 Empire Cir
- 1072 Casanova Ct
- 1325 Lyon Way Dr
- 3047 Dunlin Way
- 1230 Hampton Hill Ct Unit 1
- 2944 Clipper Ct
- 1144 Country Ct
- 3184 Long Iron Dr
- 1221 Overton Dr
- 757 Dunlin Fields Dr Unit 2
- 3270 Reagan Way
- 1069 Bar Harbor Place
- 946 Clover Ln Unit 1
- 930 Clover Ln
- 939 Bermuda Ct
- 939 Bermuda Ct Unit 1
- 945 Bermuda Ct
- 933 Bermuda Ct Unit 1
- 954 Clover Ln
- 947 Clover Ln
- 939 Clover Ln
- 951 Bermuda Ct
- 955 Clover Ln Unit 1
- 931 Clover Ln
- 3251 Fescue Cir
- 3108 Fescue Cir
- 3257 Fescue Cir
- 3114 Fescue Cir
- 932 Bermuda Ct
- 923 Clover Ln
- 3239 Fescue Cir Unit 2
- 3100 Meadowview Ln