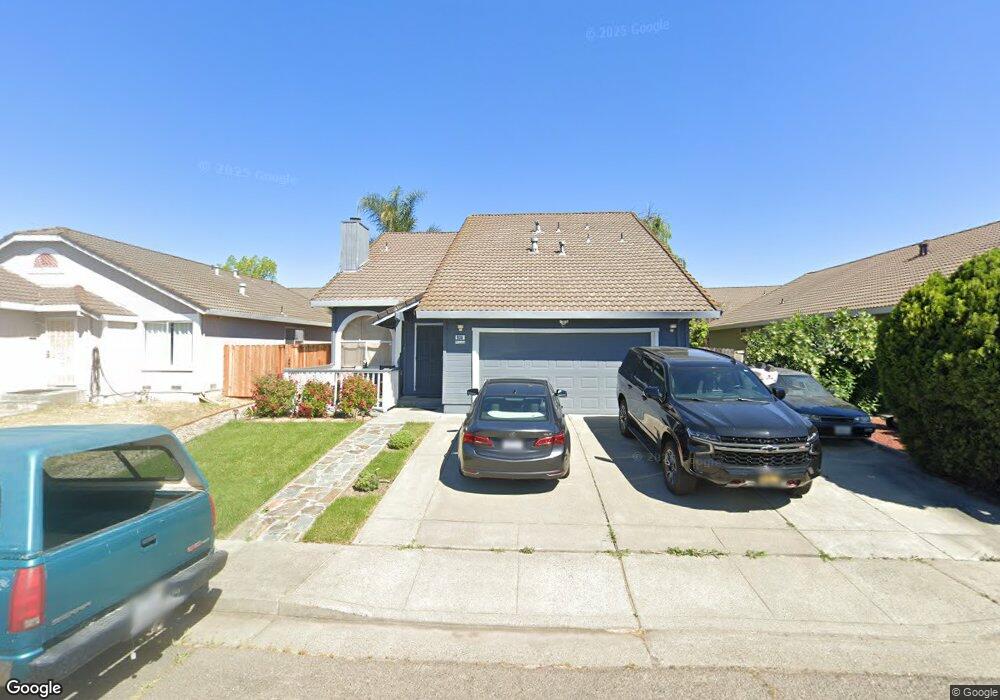
938 E Atlantic Ave Fairfield, CA 94533
Estimated Value: $542,000 - $586,000
4
Beds
3
Baths
1,813
Sq Ft
$308/Sq Ft
Est. Value
About This Home
This home is located at 938 E Atlantic Ave, Fairfield, CA 94533 and is currently estimated at $557,633, approximately $307 per square foot. 938 E Atlantic Ave is a home located in Solano County with nearby schools including Dover Elementary School, Grange Middle School, and Fairfield High School.
Ownership History
Date
Name
Owned For
Owner Type
Purchase Details
Closed on
Jun 19, 2021
Sold by
Jensen Mark S
Bought by
Jensen Mark S and Mark S Jensen Revocable Trust
Current Estimated Value
Purchase Details
Closed on
Jul 28, 1999
Sold by
Bourquin Scott J
Bought by
Jensen Mark S
Home Financials for this Owner
Home Financials are based on the most recent Mortgage that was taken out on this home.
Original Mortgage
$164,250
Outstanding Balance
$47,163
Interest Rate
7.64%
Estimated Equity
$510,470
Purchase Details
Closed on
Sep 14, 1995
Sold by
Bourquin Kelly
Bought by
Bourquin Scott J
Purchase Details
Closed on
Sep 7, 1995
Sold by
Ng Howard and Ng Lynn J
Bought by
Bourquin Scott J
Create a Home Valuation Report for This Property
The Home Valuation Report is an in-depth analysis detailing your home's value as well as a comparison with similar homes in the area
Home Values in the Area
Average Home Value in this Area
Purchase History
| Date | Buyer | Sale Price | Title Company |
|---|---|---|---|
| Jensen Mark S | -- | None Available | |
| Jensen Mark S | $182,500 | Fidelity National Title Co | |
| Bourquin Scott J | -- | -- | |
| Bourquin Scott J | -- | Fidelity National Title |
Source: Public Records
Mortgage History
| Date | Status | Borrower | Loan Amount |
|---|---|---|---|
| Open | Jensen Mark S | $164,250 |
Source: Public Records
Tax History
| Year | Tax Paid | Tax Assessment Tax Assessment Total Assessment is a certain percentage of the fair market value that is determined by local assessors to be the total taxable value of land and additions on the property. | Land | Improvement |
|---|---|---|---|---|
| 2025 | $3,147 | $280,491 | $76,844 | $203,647 |
| 2024 | $3,147 | $274,992 | $75,338 | $199,654 |
| 2023 | $3,050 | $269,601 | $73,861 | $195,740 |
| 2022 | $3,013 | $264,315 | $72,413 | $191,902 |
| 2021 | $2,984 | $259,134 | $70,994 | $188,140 |
| 2020 | $2,914 | $256,478 | $70,267 | $186,211 |
| 2019 | $2,843 | $251,450 | $68,890 | $182,560 |
| 2018 | $2,934 | $246,521 | $67,540 | $178,981 |
| 2017 | $2,799 | $241,688 | $66,216 | $175,472 |
| 2016 | $2,775 | $236,950 | $64,918 | $172,032 |
| 2015 | $2,590 | $233,391 | $63,943 | $169,448 |
| 2014 | $2,567 | $228,820 | $62,691 | $166,129 |
Source: Public Records
Map
Nearby Homes
- 2373 Dawn Way
- 2386 Baltic Ct
- 2429 Baltic Dr
- 217 Del Luz Ct
- 2049 Swan Way
- 2532 Beaufort Ct
- 175 Del Sur Ct
- 68 El Toro Ct
- 772 Largo Ct
- 2450 Oceanic Dr
- 50 El Basset Ct Unit 1
- 2202 Sandpiper Dr
- 237 Del Loma Ct
- 2275 Dover Ave
- 2513 Sunrise Dr
- 400 Santa Maria Dr
- 2219 Santa Clara Dr
- 849 Finch Way
- 1213 Sprig Ct
- 2013 Cormorant Dr
- 932 E Atlantic Ave
- 944 E Atlantic Ave
- 2389 E Atlantic Ave
- 926 E Atlantic Ave
- 933 Gold Coast Ct
- 927 Gold Coast Ct
- 939 E Atlantic Ave
- 920 E Atlantic Ave
- 945 E Atlantic Ave
- 933 E Atlantic Ave Unit 4
- 921 Gold Coast Ct
- 927 E Atlantic Ave
- 2376 E Atlantic Ave
- 2401 E Atlantic Ave
- 2382 E Atlantic Ave
- 2370 E Atlantic Ave
- 951 E Atlantic Ave
- 914 E Atlantic Ave
- 921 E Atlantic Ave
Your Personal Tour Guide
Ask me questions while you tour the home.