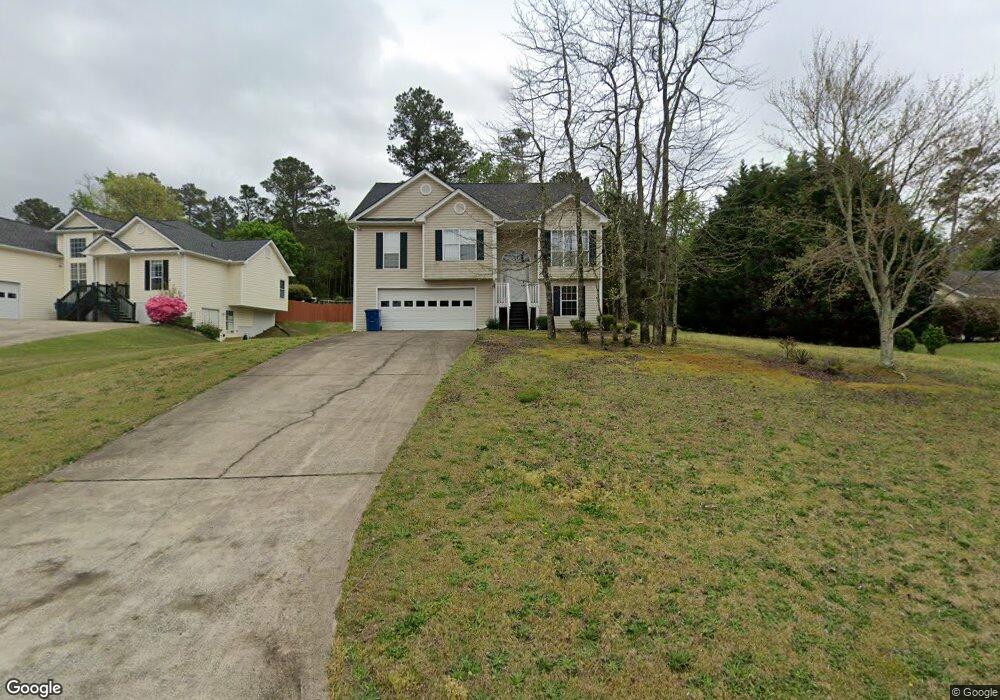
938 Lochwolde Ln Bethlehem, GA 30620
Estimated Value: $296,000 - $320,000
3
Beds
2
Baths
1,384
Sq Ft
$226/Sq Ft
Est. Value
About This Home
This home is located at 938 Lochwolde Ln, Bethlehem, GA 30620 and is currently estimated at $312,377, approximately $225 per square foot. 938 Lochwolde Ln is a home located in Barrow County with nearby schools including Yargo Elementary School, Haymon-Morris Middle School, and Apalachee High School.
Ownership History
Date
Name
Owned For
Owner Type
Purchase Details
Closed on
Dec 27, 2019
Sold by
Garrett Macksene
Bought by
Sanchez Jorge Luis and Ortiz Margarita
Current Estimated Value
Home Financials for this Owner
Home Financials are based on the most recent Mortgage that was taken out on this home.
Original Mortgage
$183,514
Outstanding Balance
$166,542
Interest Rate
5.12%
Mortgage Type
FHA
Estimated Equity
$145,835
Purchase Details
Closed on
Mar 8, 2002
Sold by
Darrell Flanigan Properties
Bought by
Garrett Macksene
Home Financials for this Owner
Home Financials are based on the most recent Mortgage that was taken out on this home.
Original Mortgage
$123,400
Interest Rate
6.95%
Mortgage Type
New Conventional
Purchase Details
Closed on
Oct 11, 2001
Sold by
Dun-La-Hur
Bought by
Darrell Flanigan Pro
Purchase Details
Closed on
Jan 14, 2000
Bought by
Dun-La-Hur
Create a Home Valuation Report for This Property
The Home Valuation Report is an in-depth analysis detailing your home's value as well as a comparison with similar homes in the area
Home Values in the Area
Average Home Value in this Area
Purchase History
| Date | Buyer | Sale Price | Title Company |
|---|---|---|---|
| Sanchez Jorge Luis | $186,900 | -- | |
| Garrett Macksene | $123,400 | -- | |
| Darrell Flanigan Pro | $26,000 | -- | |
| Dun-La-Hur | -- | -- |
Source: Public Records
Mortgage History
| Date | Status | Borrower | Loan Amount |
|---|---|---|---|
| Open | Sanchez Jorge Luis | $183,514 | |
| Previous Owner | Garrett Macksene | $123,400 |
Source: Public Records
Tax History Compared to Growth
Tax History
| Year | Tax Paid | Tax Assessment Tax Assessment Total Assessment is a certain percentage of the fair market value that is determined by local assessors to be the total taxable value of land and additions on the property. | Land | Improvement |
|---|---|---|---|---|
| 2024 | $2,519 | $99,250 | $26,000 | $73,250 |
| 2023 | $2,849 | $98,050 | $24,400 | $73,650 |
| 2022 | $1,957 | $65,666 | $18,000 | $47,666 |
| 2021 | $2,062 | $65,666 | $18,000 | $47,666 |
| 2020 | $2,007 | $63,697 | $18,000 | $45,697 |
| 2019 | $2,042 | $63,697 | $18,000 | $45,697 |
| 2018 | $1,875 | $58,897 | $13,200 | $45,697 |
| 2017 | $1,467 | $50,396 | $13,200 | $37,196 |
| 2016 | $1,366 | $42,592 | $13,200 | $29,392 |
| 2015 | $1,382 | $42,922 | $13,200 | $29,722 |
| 2014 | $1,226 | $36,520 | $6,468 | $30,052 |
| 2013 | -- | $34,626 | $6,468 | $28,158 |
Source: Public Records
Map
Nearby Homes
- 934 Beaver Hill Dr
- 1164 Otis Dr
- 1129 Loganville Hwy
- 73 Silverleaf Trail
- 704 Newnham Walk
- 64 Silverleaf Trail
- 1024 Lyndhurst Ln
- The Barnes Plan at River Meadows
- The Paisley Plan at River Meadows
- The Rose II Plan at River Meadows
- The Logan Plan at River Meadows
- 268 Silverleaf Trail
- 1529 Blakewood Trail
- 280 Silverleaf Trail
- 1111 Otis Dr
- 1381 Loganville Hwy
- 362 Silverleaf Trail
- 286 Meadows Dr
- Lancaster Plan at The Estates at Casteel
- Buckley Plan at The Estates at Casteel
- 936 Lochwolde Ln
- 940 Lochwolde Ln Unit 49
- 940 Lochwolde Ln
- 934 Lochwolde Ln
- 942 Lochwolde Ln
- 939 Lochwolde Ln
- 941 Lochwolde Ln
- 932 Lochwolde Ln
- 944 Lochwolde Ln
- 0 Wickloe Ct Unit 7345754
- 943 Lochwolde Ln
- 1132 Wickloe Ct
- 945 Lochwolde Ln
- 930 Lochwolde Ln
- 0 Lochwolde Ln Unit 8673584
- 0 Lochwolde Ln Unit 8575516
- 0 Lochwolde Ln Unit 8141721
- 0 Lochwolde Ln Unit 8062935
- 0 Lochwolde Ln Unit 8776687
- 0 Lochwolde Ln Unit 7357389