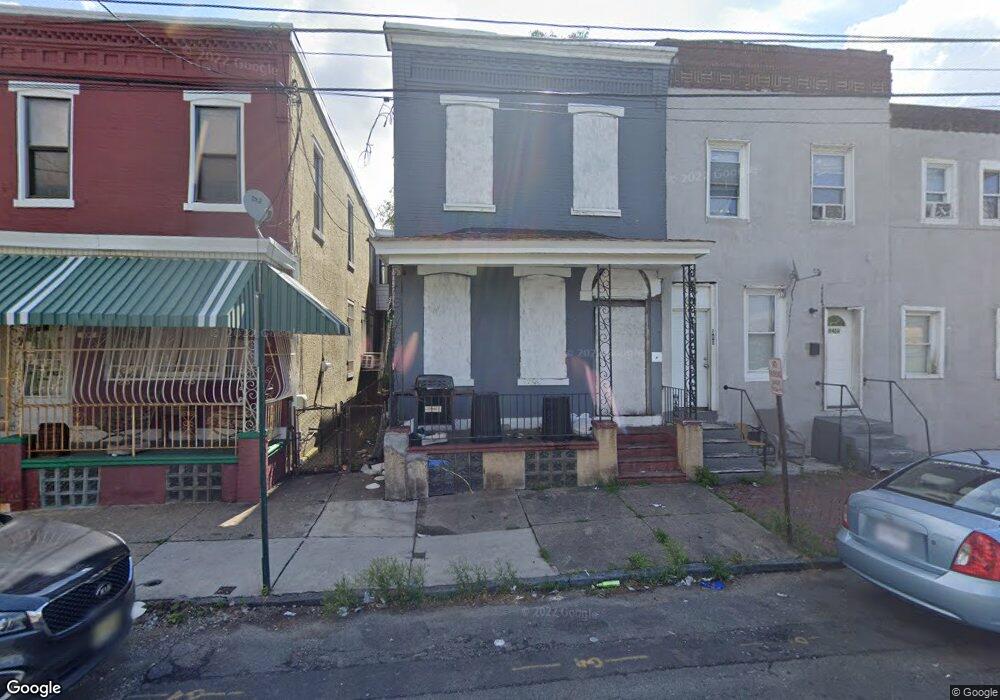
938 S 5th St Camden, NJ 08103
Bergen Square NeighborhoodEstimated Value: $57,000 - $213,000
--
Bed
--
Bath
1,918
Sq Ft
$69/Sq Ft
Est. Value
About This Home
This home is located at 938 S 5th St, Camden, NJ 08103 and is currently estimated at $132,760, approximately $69 per square foot. 938 S 5th St is a home located in Camden County with nearby schools including Camden High School, Hope Community Charter School, and Leap Academy University Charter School.
Ownership History
Date
Name
Owned For
Owner Type
Purchase Details
Closed on
Feb 23, 2016
Sold by
U S Bank Na
Bought by
Banfield Rita
Current Estimated Value
Purchase Details
Closed on
Feb 27, 2015
Sold by
Butler Phillip
Bought by
Us Bank N Na Assn
Purchase Details
Closed on
Jun 26, 2006
Sold by
Simmons Denise
Bought by
Butler Phillip and Butler Wendy
Home Financials for this Owner
Home Financials are based on the most recent Mortgage that was taken out on this home.
Original Mortgage
$69,300
Interest Rate
6.71%
Create a Home Valuation Report for This Property
The Home Valuation Report is an in-depth analysis detailing your home's value as well as a comparison with similar homes in the area
Home Values in the Area
Average Home Value in this Area
Purchase History
| Date | Buyer | Sale Price | Title Company |
|---|---|---|---|
| Banfield Rita | $14,274 | None Available | |
| Us Bank N Na Assn | -- | Attorney | |
| Butler Phillip | $77,000 | -- |
Source: Public Records
Mortgage History
| Date | Status | Borrower | Loan Amount |
|---|---|---|---|
| Previous Owner | Butler Phillip | $69,300 |
Source: Public Records
Tax History Compared to Growth
Tax History
| Year | Tax Paid | Tax Assessment Tax Assessment Total Assessment is a certain percentage of the fair market value that is determined by local assessors to be the total taxable value of land and additions on the property. | Land | Improvement |
|---|---|---|---|---|
| 2025 | $964 | $27,200 | $6,200 | $21,000 |
| 2024 | $932 | $27,200 | $6,200 | $21,000 |
| 2023 | $932 | $27,200 | $6,200 | $21,000 |
| 2022 | $914 | $27,200 | $6,200 | $21,000 |
| 2021 | $911 | $27,200 | $6,200 | $21,000 |
| 2020 | $865 | $27,200 | $6,200 | $21,000 |
| 2019 | $828 | $27,200 | $6,200 | $21,000 |
| 2018 | $824 | $27,200 | $6,200 | $21,000 |
| 2017 | $804 | $27,200 | $6,200 | $21,000 |
| 2016 | $1,379 | $48,200 | $6,200 | $42,000 |
| 2015 | $1,327 | $48,200 | $6,200 | $42,000 |
| 2014 | $1,296 | $48,200 | $6,200 | $42,000 |
Source: Public Records
Map
Nearby Homes