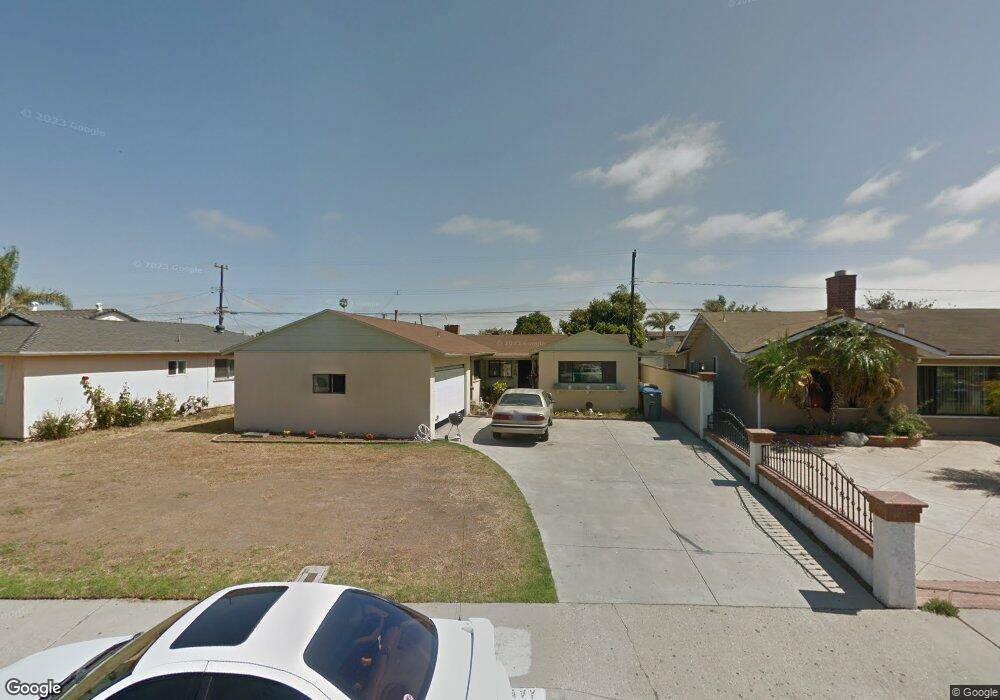
938 W Hemlock St Oxnard, CA 93033
Bartolo Square South NeighborhoodEstimated Value: $620,000 - $717,959
4
Beds
2
Baths
1,233
Sq Ft
$534/Sq Ft
Est. Value
About This Home
This home is located at 938 W Hemlock St, Oxnard, CA 93033 and is currently estimated at $658,240, approximately $533 per square foot. 938 W Hemlock St is a home located in Ventura County with nearby schools including Kamala School, Oxnard High School, and St. Anthony's Elementary School.
Ownership History
Date
Name
Owned For
Owner Type
Purchase Details
Closed on
May 17, 2023
Sold by
Young Keith E
Bought by
Young Keith and Navarro Ana
Current Estimated Value
Home Financials for this Owner
Home Financials are based on the most recent Mortgage that was taken out on this home.
Original Mortgage
$342,000
Outstanding Balance
$332,281
Interest Rate
6.27%
Mortgage Type
New Conventional
Estimated Equity
$325,959
Purchase Details
Closed on
May 10, 2023
Sold by
Young Beatrice Marie
Bought by
Young Keith E
Home Financials for this Owner
Home Financials are based on the most recent Mortgage that was taken out on this home.
Original Mortgage
$342,000
Outstanding Balance
$332,281
Interest Rate
6.27%
Mortgage Type
New Conventional
Estimated Equity
$325,959
Create a Home Valuation Report for This Property
The Home Valuation Report is an in-depth analysis detailing your home's value as well as a comparison with similar homes in the area
Home Values in the Area
Average Home Value in this Area
Purchase History
| Date | Buyer | Sale Price | Title Company |
|---|---|---|---|
| Young Keith | -- | Orange Coast Title | |
| Young Keith E | -- | None Listed On Document |
Source: Public Records
Mortgage History
| Date | Status | Borrower | Loan Amount |
|---|---|---|---|
| Open | Young Keith | $342,000 |
Source: Public Records
Tax History
| Year | Tax Paid | Tax Assessment Tax Assessment Total Assessment is a certain percentage of the fair market value that is determined by local assessors to be the total taxable value of land and additions on the property. | Land | Improvement |
|---|---|---|---|---|
| 2025 | $7,469 | $637,660 | $414,479 | $223,181 |
| 2024 | $7,469 | $603,432 | $392,231 | $211,201 |
| 2023 | $635 | $55,259 | $14,083 | $41,176 |
| 2022 | $616 | $54,176 | $13,807 | $40,369 |
| 2021 | $609 | $53,114 | $13,536 | $39,578 |
| 2020 | $619 | $52,572 | $13,399 | $39,173 |
| 2019 | $601 | $51,542 | $13,137 | $38,405 |
| 2018 | $591 | $50,532 | $12,880 | $37,652 |
| 2017 | $562 | $49,542 | $12,628 | $36,914 |
| 2016 | $542 | $48,572 | $12,381 | $36,191 |
| 2015 | $546 | $47,845 | $12,196 | $35,649 |
| 2014 | $539 | $46,909 | $11,958 | $34,951 |
Source: Public Records
Map
Nearby Homes
- 2024 S J St
- 1431 Casa San Carlos Ln Unit B
- 225 W Iris St
- 257 E Garden Green
- 269 E Elfin Green
- 236 E Bay Blvd
- 1239 S C St
- 137 E Garden Green
- 1140 Teakwood St
- 1030 Ilena St
- 1127 S C St
- 111 E Bay Blvd
- 13 W Garden Green
- 31 W Delta Green
- 75 W Fiesta Green
- 83 W Garden Green
- 102 W Alta Green
- 1820 Claremont Dr
- 1174 Oyster Place Unit 15
- 775 Thayer Ln
- 1000 W Hemlock St
- 1004 W Hemlock St
- 928 W Hemlock St
- 1014 W Hemlock St
- 1005 W Iris St
- 941 W Iris St
- 1015 W Iris St
- 920 W Hemlock St
- 935 W Hemlock St
- 1005 W Hemlock St
- 931 W Iris St
- 1023 W Iris St
- 1024 W Hemlock St
- 921 W Hemlock St
- 1015 W Hemlock St
- 921 W Iris St
- 1033 W Iris St
- 1025 W Hemlock St
- 911 W Hemlock St
- 1104 W Hemlock St
Your Personal Tour Guide
Ask me questions while you tour the home.