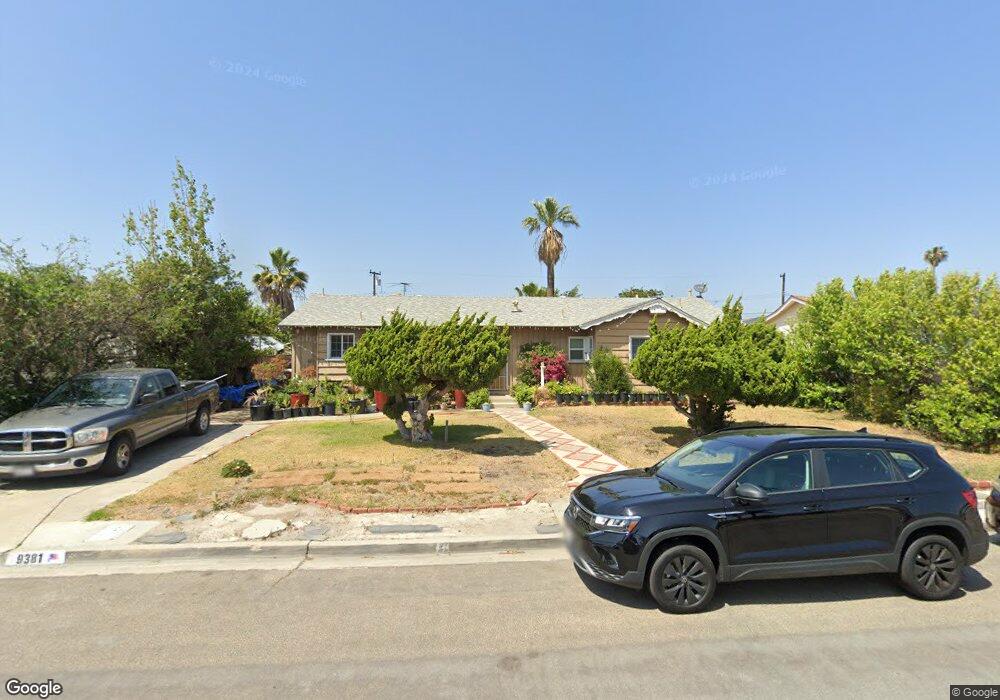
9381 Vons Dr Garden Grove, CA 92841
Estimated Value: $1,062,000 - $1,179,000
3
Beds
2
Baths
1,967
Sq Ft
$580/Sq Ft
Est. Value
About This Home
This home is located at 9381 Vons Dr, Garden Grove, CA 92841 and is currently estimated at $1,140,251, approximately $579 per square foot. 9381 Vons Dr is a home located in Orange County with nearby schools including Gilbert Elementary School, Lake Intermediate School, and Rancho Alamitos High School.
Ownership History
Date
Name
Owned For
Owner Type
Purchase Details
Closed on
Sep 14, 2007
Sold by
Vanta Viet and Ta Long Viet
Bought by
Nguyen Nhuan Thi
Current Estimated Value
Purchase Details
Closed on
Mar 21, 2003
Sold by
Vidalon Joy S and Vidalon Mario C
Bought by
Vidalon Mario C and Vidalon Joy S
Home Financials for this Owner
Home Financials are based on the most recent Mortgage that was taken out on this home.
Original Mortgage
$238,000
Interest Rate
5.78%
Purchase Details
Closed on
Nov 18, 2002
Sold by
Sun Chung Yi and Chen Mei Fang
Bought by
Vidalon Mario C and Vidalon Joy S
Home Financials for this Owner
Home Financials are based on the most recent Mortgage that was taken out on this home.
Original Mortgage
$40,000
Interest Rate
6.12%
Mortgage Type
Credit Line Revolving
Create a Home Valuation Report for This Property
The Home Valuation Report is an in-depth analysis detailing your home's value as well as a comparison with similar homes in the area
Purchase History
| Date | Buyer | Sale Price | Title Company |
|---|---|---|---|
| Nguyen Nhuan Thi | -- | None Available | |
| Vidalon Mario C | -- | First American Title | |
| Vidalon Mario C | -- | North American Title Co |
Source: Public Records
Mortgage History
| Date | Status | Borrower | Loan Amount |
|---|---|---|---|
| Previous Owner | Vidalon Mario C | $238,000 | |
| Previous Owner | Vidalon Mario C | $40,000 |
Source: Public Records
Tax History
| Year | Tax Paid | Tax Assessment Tax Assessment Total Assessment is a certain percentage of the fair market value that is determined by local assessors to be the total taxable value of land and additions on the property. | Land | Improvement |
|---|---|---|---|---|
| 2025 | $5,581 | $459,054 | $321,125 | $137,929 |
| 2024 | $5,581 | $450,053 | $314,828 | $135,225 |
| 2023 | $5,474 | $441,229 | $308,655 | $132,574 |
| 2022 | $5,391 | $432,578 | $302,603 | $129,975 |
| 2021 | $5,336 | $424,097 | $296,670 | $127,427 |
| 2020 | $5,275 | $419,749 | $293,628 | $126,121 |
| 2019 | $5,144 | $411,519 | $287,870 | $123,649 |
| 2018 | $5,058 | $403,450 | $282,225 | $121,225 |
| 2017 | $4,988 | $395,540 | $276,691 | $118,849 |
| 2016 | $4,739 | $387,785 | $271,266 | $116,519 |
| 2015 | $4,679 | $381,961 | $267,192 | $114,769 |
| 2014 | $4,518 | $374,479 | $261,958 | $112,521 |
Source: Public Records
Map
Nearby Homes
- 11432 Pollard Dr
- 11421 Barclay Dr
- 11222 Magnolia St
- 9562 Canton Ave
- 11606 Ellery Dr
- 11131 Mac Murray St
- 11662 Magnolia St
- 11782 Ardis Dr
- 11192 Biscayne Ct
- 9862 Royal Palm Blvd
- 1765 S Biscayne Ct
- 11511 Mac Nab St
- 11532 Mac St
- 10773 Magnolia Ave Unit 102
- 9155 Pacific Ave Unit 265
- 10601 Patricia Dr
- 10802 Mac St
- 11239 Bowles Ave
- 8681 Katella Ave
- 8681 Katella Ave Unit SPC 810
Your Personal Tour Guide
Ask me questions while you tour the home.