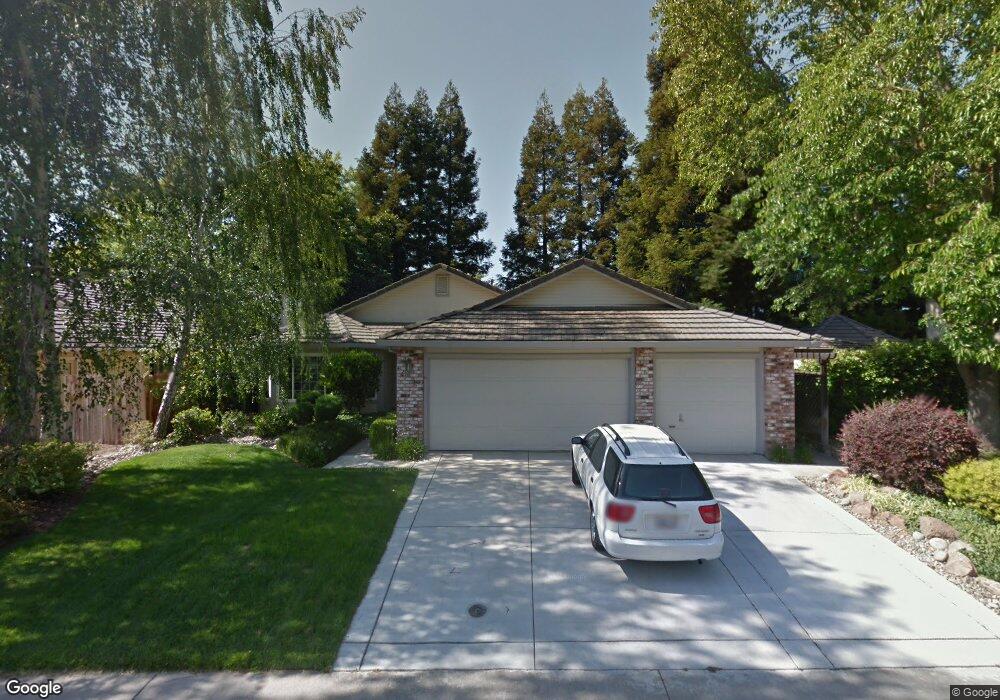
9387 Forest Vista Way Elk Grove, CA 95758
North West Elk Grove NeighborhoodEstimated Value: $366,000 - $636,000
3
Beds
2
Baths
1,476
Sq Ft
$355/Sq Ft
Est. Value
About This Home
This home is located at 9387 Forest Vista Way, Elk Grove, CA 95758 and is currently estimated at $524,496, approximately $355 per square foot. 9387 Forest Vista Way is a home located in Sacramento County with nearby schools including Foulks Ranch Elementary School, Harriet G. Eddy Middle School, and Laguna Creek High School.
Ownership History
Date
Name
Owned For
Owner Type
Purchase Details
Closed on
Jan 25, 2013
Sold by
Pedersen Melvin L and Pedersen Carolyn A
Bought by
Pedersen Melvin L and Pedersen Carolyn A
Current Estimated Value
Home Financials for this Owner
Home Financials are based on the most recent Mortgage that was taken out on this home.
Original Mortgage
$95,500
Outstanding Balance
$66,512
Interest Rate
3.33%
Mortgage Type
New Conventional
Estimated Equity
$457,984
Purchase Details
Closed on
Jul 3, 2002
Sold by
Pedersen Melvin L and Pedersen Carolyn A
Bought by
Pedersen Melvin L and Pedersen Carolyn A
Purchase Details
Closed on
Apr 27, 1994
Sold by
Pedersen Floyd and Pedersen Jean
Bought by
Pedersen Melvin L and Pedersen Carolyn A
Home Financials for this Owner
Home Financials are based on the most recent Mortgage that was taken out on this home.
Original Mortgage
$117,600
Interest Rate
7.84%
Create a Home Valuation Report for This Property
The Home Valuation Report is an in-depth analysis detailing your home's value as well as a comparison with similar homes in the area
Home Values in the Area
Average Home Value in this Area
Purchase History
| Date | Buyer | Sale Price | Title Company |
|---|---|---|---|
| Pedersen Melvin L | -- | Placer Title Company | |
| Pedersen Melvin L | -- | Placer Title Company | |
| Pedersen Melvin L | -- | -- | |
| Pedersen Melvin L | $154,000 | -- |
Source: Public Records
Mortgage History
| Date | Status | Borrower | Loan Amount |
|---|---|---|---|
| Open | Pedersen Melvin L | $95,500 | |
| Closed | Pedersen Melvin L | $117,600 |
Source: Public Records
Tax History Compared to Growth
Tax History
| Year | Tax Paid | Tax Assessment Tax Assessment Total Assessment is a certain percentage of the fair market value that is determined by local assessors to be the total taxable value of land and additions on the property. | Land | Improvement |
|---|---|---|---|---|
| 2025 | $3,249 | $282,043 | $76,467 | $205,576 |
| 2024 | $3,249 | $276,514 | $74,968 | $201,546 |
| 2023 | $3,163 | $271,094 | $73,499 | $197,595 |
| 2022 | $3,094 | $265,779 | $72,058 | $193,721 |
| 2021 | $2,891 | $246,844 | $70,646 | $176,198 |
| 2020 | $2,797 | $239,314 | $69,922 | $169,392 |
| 2019 | $2,740 | $234,622 | $68,551 | $166,071 |
| 2018 | $2,665 | $230,022 | $67,207 | $162,815 |
| 2017 | $2,614 | $225,513 | $65,890 | $159,623 |
| 2016 | $2,485 | $221,093 | $64,599 | $156,494 |
| 2015 | $2,438 | $217,773 | $63,629 | $154,144 |
| 2014 | $2,398 | $213,508 | $62,383 | $151,125 |
Source: Public Records
Map
Nearby Homes
- 9301 Kilcolgan Way
- 9434 Forest Vista Way
- 9333 Newington Way
- 9438 Dunkerrin Way
- 6016 Laguna Park Dr
- 6008 Laguna Villa Way
- 6421 Noble House Ct
- 9236 Mapleview Way
- 7120 Beaver Falls Way
- 6906 Paseo Del Sol Way
- 6805 Paseo Del Sol Way
- 5912 Laguna Villa Way
- 7109 Ballygar Way
- 6348 Laguna Mirage Ln
- 5817 Sparrow Hawk Ct
- 9364 Ivydale Cir
- 5845 Laguna Shore Way
- 7105 Fall Way
- 7300 Saltgrass Way
- 7021 Tiant Way
- 9401 Forest Vista Way
- 9381 Forest Vista Way
- 6440 Contente Way
- 9405 Forest Vista Way
- 6444 Contente Way
- 6436 Contente Way
- 9382 Forest Vista Way
- 9400 Forest Vista Way
- 6432 Contente Way
- 6448 Contente Way
- 9409 Forest Vista Way
- 9406 Forest Vista Way
- 6428 Contente Way
- 9386 Forest Vista Way
- 9413 Forest Vista Way
- 6441 Contente Way
- 9567 Oak Reserve Ln
- 6437 Contente Way
- 6445 Contente Way
- 9394 Forest Vista Way