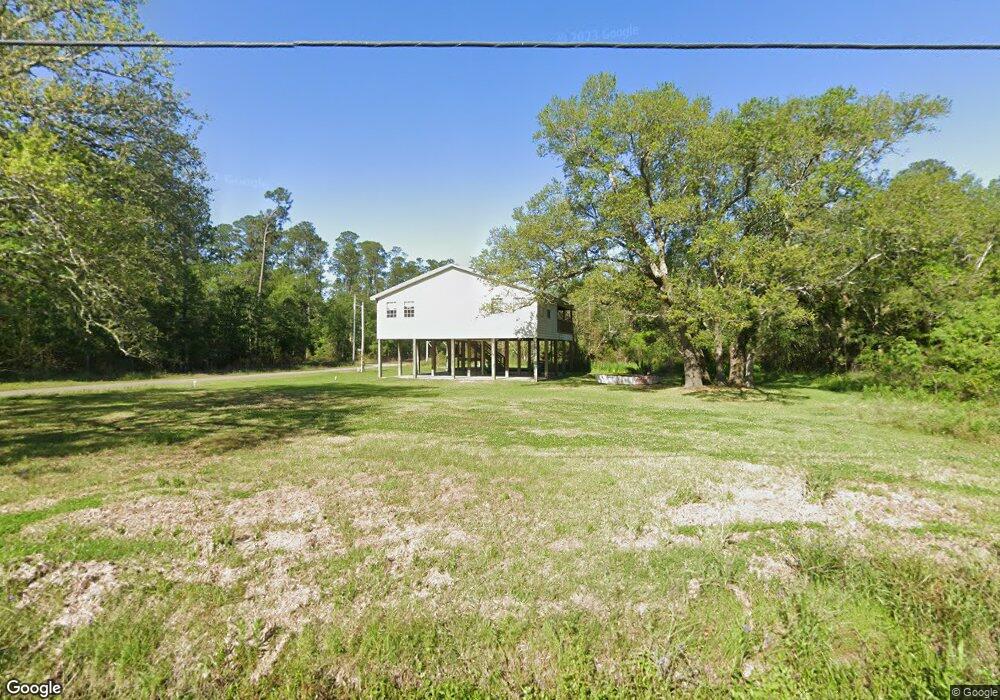
9389 Harbor Dr Bay Saint Louis, MS 39520
Estimated Value: $174,000 - $189,000
2
Beds
2
Baths
1,350
Sq Ft
$135/Sq Ft
Est. Value
About This Home
This home is located at 9389 Harbor Dr, Bay Saint Louis, MS 39520 and is currently estimated at $181,678, approximately $134 per square foot. 9389 Harbor Dr is a home located in Hancock County with nearby schools including Picayune Junior High School, Picayune Memorial High School, and Central Christian Academy.
Ownership History
Date
Name
Owned For
Owner Type
Purchase Details
Closed on
Jul 18, 2025
Sold by
Parks Holdings 9 Llc
Bought by
Dumond Kelly
Current Estimated Value
Purchase Details
Closed on
Jan 29, 2025
Sold by
Coast 85 Home Solutions Llc
Bought by
Parks Holdings 9 Llc
Home Financials for this Owner
Home Financials are based on the most recent Mortgage that was taken out on this home.
Original Mortgage
$149,000
Interest Rate
6.85%
Mortgage Type
Construction
Purchase Details
Closed on
Jan 28, 2025
Sold by
Carr James Thomas
Bought by
Coast 85 Home Solutions Llc
Home Financials for this Owner
Home Financials are based on the most recent Mortgage that was taken out on this home.
Original Mortgage
$149,000
Interest Rate
6.85%
Mortgage Type
Construction
Create a Home Valuation Report for This Property
The Home Valuation Report is an in-depth analysis detailing your home's value as well as a comparison with similar homes in the area
Home Values in the Area
Average Home Value in this Area
Purchase History
| Date | Buyer | Sale Price | Title Company |
|---|---|---|---|
| Dumond Kelly | -- | Pilger Title | |
| Dumond Kelly | -- | Pilger Title | |
| Parks Holdings 9 Llc | -- | Pilger Title | |
| Parks Holdings 9 Llc | -- | Pilger Title | |
| Coast 85 Home Solutions Llc | -- | Pilger Title | |
| Coast 85 Home Solutions Llc | -- | Pilger Title |
Source: Public Records
Mortgage History
| Date | Status | Borrower | Loan Amount |
|---|---|---|---|
| Previous Owner | Parks Holdings 9 Llc | $149,000 |
Source: Public Records
Tax History Compared to Growth
Tax History
| Year | Tax Paid | Tax Assessment Tax Assessment Total Assessment is a certain percentage of the fair market value that is determined by local assessors to be the total taxable value of land and additions on the property. | Land | Improvement |
|---|---|---|---|---|
| 2024 | $1,696 | $17,808 | $2,550 | $15,258 |
| 2023 | $1,648 | $17,303 | $2,550 | $14,753 |
| 2022 | $1,648 | $17,303 | $2,550 | $14,753 |
| 2021 | $1,484 | $15,578 | $825 | $14,753 |
| 2020 | $1,380 | $13,965 | $825 | $13,140 |
| 2019 | $1,420 | $14,375 | $1,050 | $13,325 |
| 2018 | $1,524 | $15,425 | $2,100 | $13,325 |
| 2017 | $1,524 | $15,425 | $2,100 | $13,325 |
| 2016 | $1,486 | $15,425 | $2,100 | $13,325 |
| 2015 | $1,256 | $13,747 | $2,100 | $11,647 |
| 2014 | $1,230 | $13,747 | $2,100 | $11,647 |
| 2013 | $1,186 | $13,747 | $2,100 | $11,647 |
Source: Public Records
Map
Nearby Homes
- Lot 11 Harbor Dr
- 000 1st (Lots 99-101) St
- 0 Lark St
- 6046 1st St
- 00 3rd St
- 0 Hattiesburg Unit 4111720
- 0 Fig Dr Unit 4130504
- 0 Fig Dr Unit 4118383
- 0 Fig Dr Unit 4118381
- 8005 Spruce St
- 4th Taft St
- 6018 Cedar Dr
- 0 3rd St
- Lot 61-64 Apricot St
- 0 Cedar Dr
- 0 Robin St Unit 4043929
- 0 Robin St
- 0 8th St Unit 4126499
- 0 8th St Unit 4123561
- 81 & 82 Dove St
- 6087 Gull St St
- 6087 Gull St
- 6047 Lark St
- 9421 Harbor Dr
- 6132 Gull St
- 9420 Harbor Dr
- 6048 Lark St
- 9016 Swallow Ln
- 6052 Gull St
- 9295 Lark St
- 9403 Lark St
- Lot 93-95 Harbor Dr
- L 91-92 Harbor Dr
- 0 1st St Unit 2074876
- 6029 1st St
- 9081 Jay St
- Lot 99-101 1st St
- Lots 97-98 1st St
- 9325 Harbor Dr
- 99-101 1st St