Estimated Value: $382,625 - $492,000
3
Beds
3
Baths
3,267
Sq Ft
$133/Sq Ft
Est. Value
About This Home
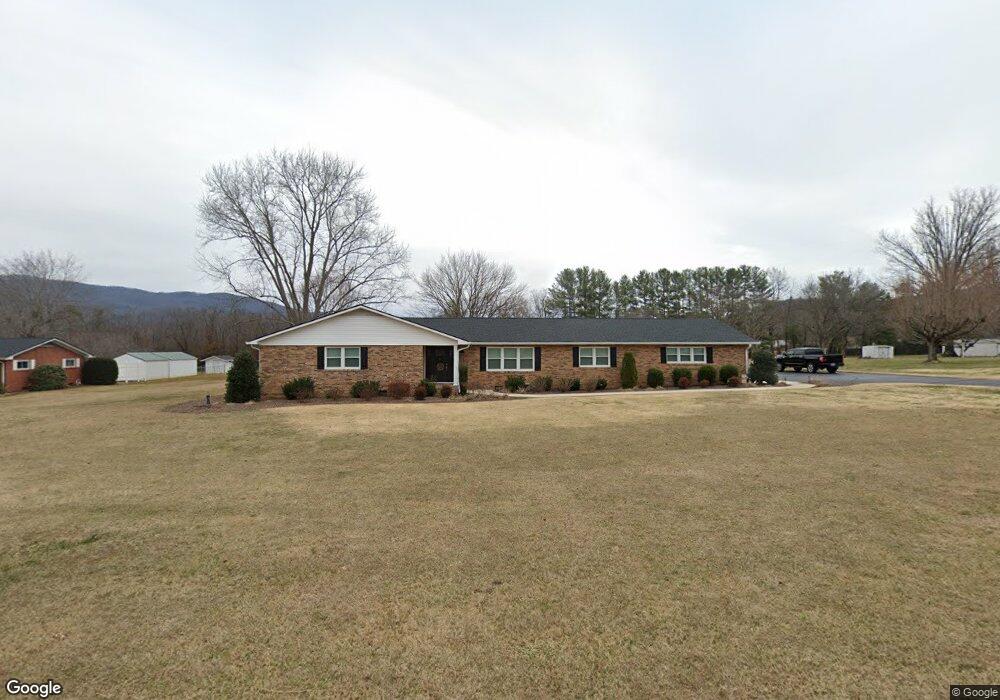
This home is located at 939 9th St Unit 2, Erwin, TN 37650 and is currently estimated at $433,656, approximately $132 per square foot. 939 9th St Unit 2 is a home located in Unicoi County with nearby schools including Rock Creek Elementary School, Unicoi County Middle School, and Unicoi County High School.
Ownership History
Date
Name
Owned For
Owner Type
Purchase Details
Closed on
Apr 28, 2025
Sold by
Rice Rachel M
Bought by
Rice Andrew Mark
Current Estimated Value
Purchase Details
Closed on
Nov 16, 2020
Sold by
Rhodes Janice
Bought by
Rice Andrew Mark and Rice Rachel M
Home Financials for this Owner
Home Financials are based on the most recent Mortgage that was taken out on this home.
Original Mortgage
$252,000
Interest Rate
3.25%
Mortgage Type
Adjustable Rate Mortgage/ARM
Purchase Details
Closed on
Aug 3, 2018
Sold by
France Gisele C and Montgomery Gisele C
Bought by
Rhodes Leon and Rhodes Janic
Purchase Details
Closed on
Mar 30, 2007
Sold by
Teresa Palmer Karen
Bought by
Montgomery Gisele C
Home Financials for this Owner
Home Financials are based on the most recent Mortgage that was taken out on this home.
Original Mortgage
$139,000
Interest Rate
6.15%
Purchase Details
Closed on
Aug 18, 2004
Sold by
Hensley Mccurry Vera
Bought by
Teresa Palmer Karen
Create a Home Valuation Report for This Property
The Home Valuation Report is an in-depth analysis detailing your home's value as well as a comparison with similar homes in the area
Home Values in the Area
Average Home Value in this Area
Purchase History
| Date | Buyer | Sale Price | Title Company |
|---|---|---|---|
| Rice Andrew Mark | -- | None Listed On Document | |
| Rice Andrew Mark | -- | None Listed On Document | |
| Rice Andrew Mark | $315,000 | Debbie Title | |
| Rhodes Leon | $220,000 | None Available | |
| Montgomery Gisele C | $226,000 | -- | |
| Teresa Palmer Karen | $140,000 | -- |
Source: Public Records
Mortgage History
| Date | Status | Borrower | Loan Amount |
|---|---|---|---|
| Previous Owner | Rice Andrew Mark | $252,000 | |
| Previous Owner | Teresa Palmer Karen | $139,000 |
Source: Public Records
Tax History
| Year | Tax Paid | Tax Assessment Tax Assessment Total Assessment is a certain percentage of the fair market value that is determined by local assessors to be the total taxable value of land and additions on the property. | Land | Improvement |
|---|---|---|---|---|
| 2025 | $2,092 | $80,125 | $14,825 | $65,300 |
| 2024 | $2,092 | $80,125 | $14,825 | $65,300 |
| 2023 | $2,092 | $80,125 | $0 | $0 |
| 2022 | $3,126 | $80,125 | $14,825 | $65,300 |
| 2021 | $2,718 | $57,625 | $11,400 | $46,225 |
| 2020 | $2,620 | $57,625 | $11,400 | $46,225 |
| 2019 | $2,620 | $57,625 | $11,400 | $46,225 |
| 2018 | $2,389 | $57,625 | $11,400 | $46,225 |
| 2017 | $2,381 | $57,625 | $11,400 | $46,225 |
| 2016 | $2,425 | $59,250 | $11,450 | $47,800 |
| 2015 | $2,230 | $59,250 | $0 | $0 |
| 2014 | $2,230 | $59,250 | $0 | $0 |
Source: Public Records
Map
Nearby Homes
- 315 Liberty Ave
- 538 Rock Creek Rd
- 317 Simmons Ave
- 511 Old Stage Rd
- 720 N Mohawk Dr
- 121 Smith Ave
- 1012 Mountainview Rd
- 000 Galax Dr
- 165 Smith Ave
- 106 Hasty Blvd
- 116 Hasty Blvd
- 1027 N Elm Ave
- 557 Valley Ave
- 600 Valley Ave
- 412 Railroad St
- 752 N Main Ave
- Tbd Old Fishery Rd
- 708 N Main Ave
- 709 N Main Ave Unit 4
- 707 N Main Ave Unit 3
Your Personal Tour Guide
Ask me questions while you tour the home.