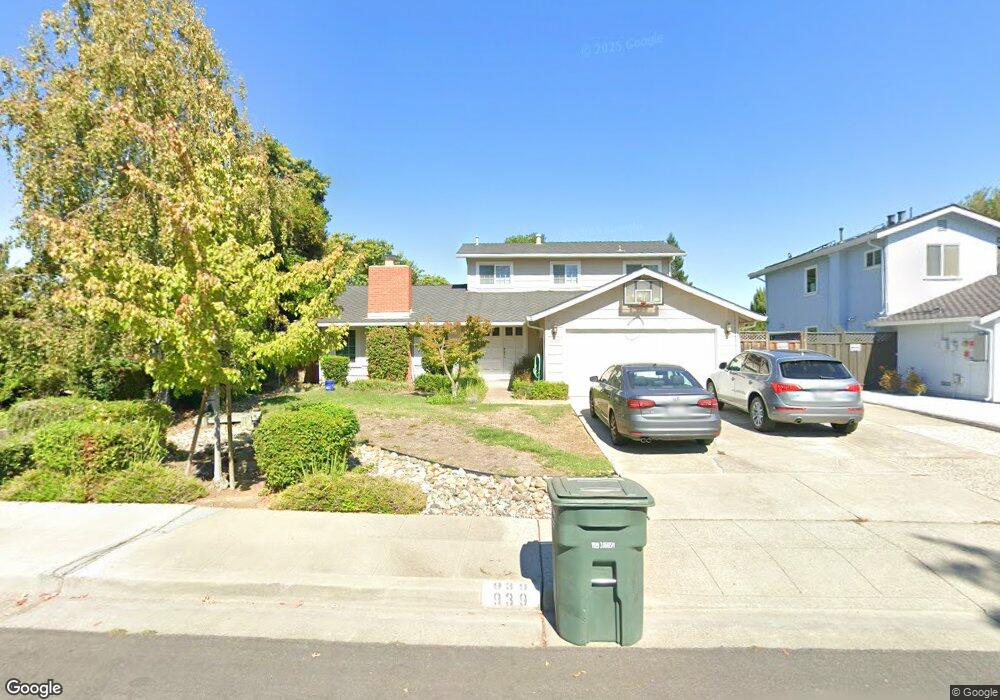
939 Azalea Dr Sunnyvale, CA 94086
Ponderosa Park NeighborhoodEstimated Value: $2,369,000 - $2,812,000
4
Beds
2
Baths
966
Sq Ft
$2,640/Sq Ft
Est. Value
About This Home
This home is located at 939 Azalea Dr, Sunnyvale, CA 94086 and is currently estimated at $2,550,716, approximately $2,640 per square foot. 939 Azalea Dr is a home located in Santa Clara County with nearby schools including Braly Elementary School, Marian A. Peterson Middle School, and Adrian Wilcox High School.
Ownership History
Date
Name
Owned For
Owner Type
Purchase Details
Closed on
Jan 18, 2018
Sold by
Schallau Linda S
Bought by
Schallau Linda S
Current Estimated Value
Home Financials for this Owner
Home Financials are based on the most recent Mortgage that was taken out on this home.
Original Mortgage
$500,000
Outstanding Balance
$395,385
Interest Rate
3.94%
Mortgage Type
Credit Line Revolving
Estimated Equity
$2,155,331
Purchase Details
Closed on
Oct 23, 2012
Sold by
Schallau John P and Schallau Linda S
Bought by
Schallau Linda S
Home Financials for this Owner
Home Financials are based on the most recent Mortgage that was taken out on this home.
Original Mortgage
$598,350
Interest Rate
3.5%
Mortgage Type
New Conventional
Purchase Details
Closed on
Apr 2, 1999
Sold by
Kirsten Jeff P and Kirsten Tracy
Bought by
Schallau John P and Schallau Linda S
Home Financials for this Owner
Home Financials are based on the most recent Mortgage that was taken out on this home.
Original Mortgage
$428,000
Interest Rate
6.91%
Create a Home Valuation Report for This Property
The Home Valuation Report is an in-depth analysis detailing your home's value as well as a comparison with similar homes in the area
Home Values in the Area
Average Home Value in this Area
Purchase History
| Date | Buyer | Sale Price | Title Company |
|---|---|---|---|
| Schallau Linda S | -- | Chicago Title Co | |
| Schallau Linda S | -- | Old Republic Title Company | |
| Schallau John P | $535,000 | North American Title Co |
Source: Public Records
Mortgage History
| Date | Status | Borrower | Loan Amount |
|---|---|---|---|
| Open | Schallau Linda S | $500,000 | |
| Closed | Schallau Linda S | $598,350 | |
| Closed | Schallau John P | $428,000 | |
| Closed | Schallau John P | $53,500 |
Source: Public Records
Tax History
| Year | Tax Paid | Tax Assessment Tax Assessment Total Assessment is a certain percentage of the fair market value that is determined by local assessors to be the total taxable value of land and additions on the property. | Land | Improvement |
|---|---|---|---|---|
| 2025 | $9,604 | $838,711 | $627,080 | $211,631 |
| 2024 | $9,604 | $822,267 | $614,785 | $207,482 |
| 2023 | $9,528 | $806,145 | $602,731 | $203,414 |
| 2022 | $9,399 | $790,339 | $590,913 | $199,426 |
| 2021 | $9,368 | $774,843 | $579,327 | $195,516 |
| 2020 | $9,197 | $766,899 | $573,387 | $193,512 |
| 2019 | $9,183 | $751,863 | $562,145 | $189,718 |
| 2018 | $8,596 | $737,122 | $551,123 | $185,999 |
| 2017 | $8,544 | $722,669 | $540,317 | $182,352 |
| 2016 | $8,386 | $708,500 | $529,723 | $178,777 |
| 2015 | $8,353 | $697,859 | $521,767 | $176,092 |
| 2014 | $7,956 | $684,190 | $511,547 | $172,643 |
Source: Public Records
Map
Nearby Homes
- 212 Red Oak Dr E Unit A
- 999 W Evelyn Terrace Unit 75
- 999 W Evelyn Terrace Unit 40
- 999 W Evelyn Terrace Unit 54
- 1006 E Evelyn Ave
- 247 Peppermint Tree Terrace Unit 5
- 338 Amaryllis Terrace
- 775 Ajax Dr
- 129 Paperbark Terrace
- 176 Jeffrey Terrace
- 108 Lemmon Terrace
- 183 Jeffrey Terrace
- 1052 Aster Ave
- 201 Stone Pine Terrace Unit 2
- 1062 Barberry Terrace
- 1102 Althea Terrace Unit 6
- 1102 Althea Terrace Unit 1
- 1102 Althea Terrace Unit 2
- 1102 Althea Terrace Unit 4
- 792 Ponderosa Ave
- 945 Azalea Dr
- 935 Azalea Dr
- 938 E Evelyn Ave
- 944 E Evelyn Ave
- 951 Azalea Dr
- 931 Azalea Dr
- 932 E Evelyn Ave
- 942 Azalea Dr
- 948 Azalea Dr
- 936 Azalea Dr
- 952 E Evelyn Ave
- 927 Azalea Dr
- 957 Azalea Dr
- 954 Azalea Dr
- 930 E Evelyn Ave
- 930 Azalea Dr
- 960 Azalea Dr
- 928 E Evelyn Ave
- 956 E Evelyn Ave
- 925 Azalea Dr
Your Personal Tour Guide
Ask me questions while you tour the home.