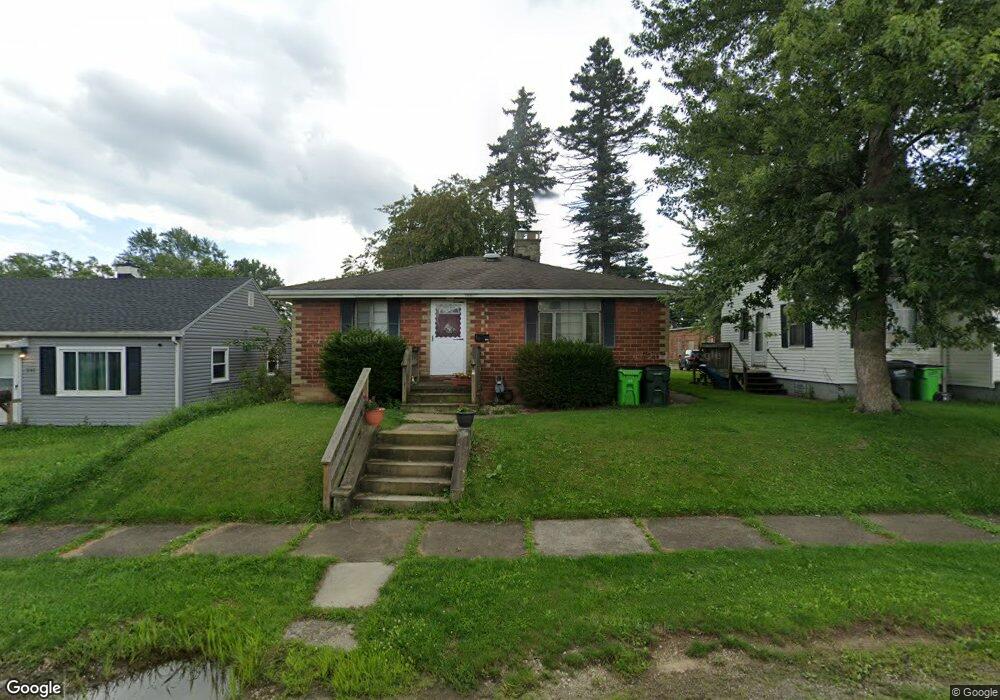
939 Devine St Alliance, OH 44601
Estimated Value: $67,000 - $109,000
2
Beds
2
Baths
868
Sq Ft
$106/Sq Ft
Est. Value
About This Home
This home is located at 939 Devine St, Alliance, OH 44601 and is currently estimated at $92,001, approximately $105 per square foot. 939 Devine St is a home located in Stark County with nearby schools including Alliance Elementary School at Rockhill, Alliance Intermediate School at Northside, and Alliance Middle School.
Ownership History
Date
Name
Owned For
Owner Type
Purchase Details
Closed on
Dec 17, 2003
Sold by
Buckeye State Cu
Bought by
Stiffler Irvin and Stiffler Karen
Current Estimated Value
Purchase Details
Closed on
Oct 30, 2003
Sold by
Mandolesi Michael G
Bought by
Buckeye State Cu
Purchase Details
Closed on
Feb 22, 1999
Sold by
Nfn Group Inc
Bought by
Mandolesi Michael G
Home Financials for this Owner
Home Financials are based on the most recent Mortgage that was taken out on this home.
Original Mortgage
$45,600
Interest Rate
6.88%
Mortgage Type
Purchase Money Mortgage
Purchase Details
Closed on
Dec 9, 1998
Sold by
Neely James C
Bought by
Nfm Group Inc
Purchase Details
Closed on
Oct 28, 1998
Sold by
Pittman Tina and Pittman Gary
Bought by
Neely James C
Purchase Details
Closed on
Oct 2, 1992
Create a Home Valuation Report for This Property
The Home Valuation Report is an in-depth analysis detailing your home's value as well as a comparison with similar homes in the area
Home Values in the Area
Average Home Value in this Area
Purchase History
| Date | Buyer | Sale Price | Title Company |
|---|---|---|---|
| Stiffler Irvin | $46,000 | First American Equity Loan S | |
| Buckeye State Cu | -- | -- | |
| Mandolesi Michael G | $48,000 | Union Title Company | |
| Nfm Group Inc | -- | -- | |
| Neely James C | $32,000 | -- | |
| -- | $25,000 | -- |
Source: Public Records
Mortgage History
| Date | Status | Borrower | Loan Amount |
|---|---|---|---|
| Previous Owner | Mandolesi Michael G | $45,600 |
Source: Public Records
Tax History
| Year | Tax Paid | Tax Assessment Tax Assessment Total Assessment is a certain percentage of the fair market value that is determined by local assessors to be the total taxable value of land and additions on the property. | Land | Improvement |
|---|---|---|---|---|
| 2025 | -- | $21,290 | $4,940 | $16,350 |
| 2024 | -- | $21,290 | $4,940 | $16,350 |
| 2023 | $715 | $17,790 | $4,730 | $13,060 |
| 2022 | $720 | $17,790 | $4,730 | $13,060 |
| 2021 | $720 | $17,790 | $4,730 | $13,060 |
| 2020 | $660 | $15,230 | $4,100 | $11,130 |
| 2019 | $651 | $15,230 | $4,100 | $11,130 |
Source: Public Records
Map
Nearby Homes
- 834 Devine St
- 1522 Wade Ave
- 1608 S Liberty Ave
- 1823 S Seneca Ave
- 1350 S Freedom Ave
- 935 S Morgan Ave
- 233 Shadyside Ct
- 2041 Watson Ave
- 167 11th St
- 955 E Summit St
- 226 Milner St
- 231 Rosenberry St
- 134 11th St
- 234 Rosenberry St
- 22862 Norman Ave
- 2408 S Linden Ave
- 152 E Mill St
- 853 Fairway Dr
- 452 E Summit St
- 726 S Arch Ave
Your Personal Tour Guide
Ask me questions while you tour the home.