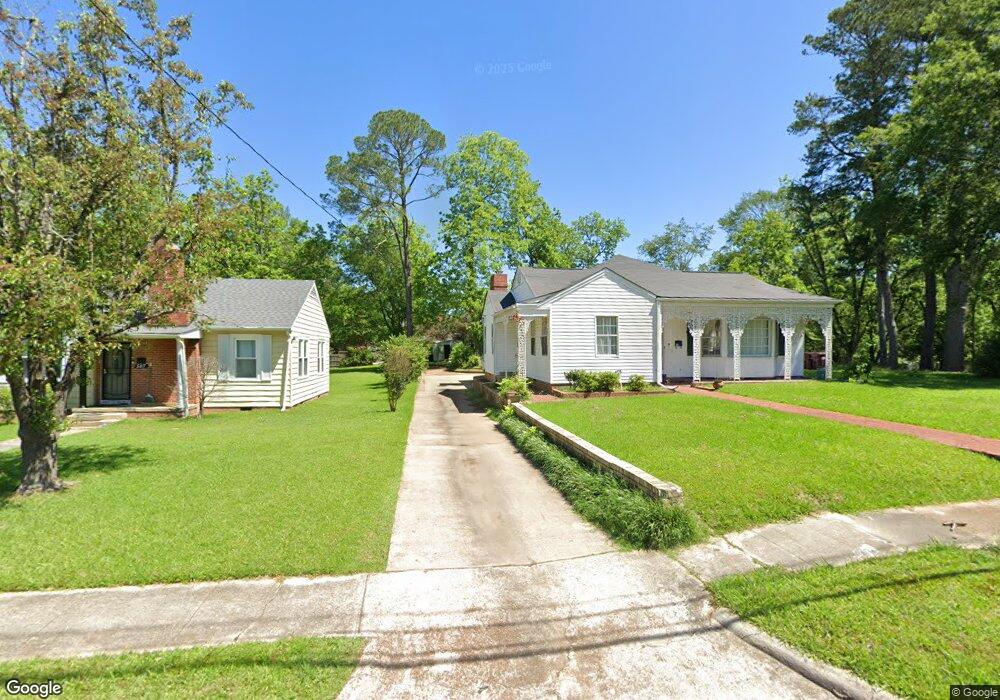
939 E Westbrook St West Point, MS 39773
Estimated Value: $150,000 - $209,000
3
Beds
--
Bath
2,562
Sq Ft
$73/Sq Ft
Est. Value
About This Home
This home is located at 939 E Westbrook St, West Point, MS 39773 and is currently estimated at $186,226, approximately $72 per square foot. 939 E Westbrook St is a home located in Clay County with nearby schools including East Side Elementary School, West Clay Elementary School, and Church Hill Elementary School.
Ownership History
Date
Name
Owned For
Owner Type
Purchase Details
Closed on
Nov 7, 2022
Sold by
Abdulla Khaled M and Abdulla Amal
Bought by
Abdulla Naji and Ghadir Almuhsan
Current Estimated Value
Home Financials for this Owner
Home Financials are based on the most recent Mortgage that was taken out on this home.
Original Mortgage
$40,000
Outstanding Balance
$38,589
Interest Rate
6.92%
Mortgage Type
Seller Take Back
Estimated Equity
$147,637
Purchase Details
Closed on
Jul 28, 2014
Sold by
Marquiest Marquiest
Bought by
Amal Abdull Khaled M and Amal Maggali
Create a Home Valuation Report for This Property
The Home Valuation Report is an in-depth analysis detailing your home's value as well as a comparison with similar homes in the area
Purchase History
| Date | Buyer | Sale Price | Title Company |
|---|---|---|---|
| Abdulla Naji | -- | -- | |
| Amal Abdull Khaled M | -- | -- |
Source: Public Records
Mortgage History
| Date | Status | Borrower | Loan Amount |
|---|---|---|---|
| Open | Abdulla Naji | $40,000 |
Source: Public Records
Tax History
| Year | Tax Paid | Tax Assessment Tax Assessment Total Assessment is a certain percentage of the fair market value that is determined by local assessors to be the total taxable value of land and additions on the property. | Land | Improvement |
|---|---|---|---|---|
| 2025 | $1,156 | $14,207 | $1,771 | $12,436 |
| 2024 | $1,156 | $21,310 | $2,657 | $18,653 |
| 2023 | $1,777 | $11,873 | $1,771 | $10,102 |
| 2022 | $497 | $11,873 | $1,771 | $10,102 |
| 2021 | $496 | $11,873 | $1,771 | $10,102 |
| 2020 | $495 | $11,873 | $1,771 | $10,102 |
| 2019 | $459 | $11,782 | $1,771 | $10,011 |
| 2018 | $433 | $11,782 | $1,771 | $10,011 |
| 2017 | $433 | $11,782 | $1,771 | $10,011 |
| 2016 | $411 | $11,782 | $1,771 | $10,011 |
| 2015 | $376 | $10,670 | $1,771 | $8,899 |
| 2014 | $140 | $10,670 | $1,771 | $8,899 |
| 2013 | $140 | $10,670 | $1,771 | $8,899 |
Source: Public Records
Map
Nearby Homes
- 551 E Westbrook St
- 26596 E Main St
- 26852 E Main St
- 27045 E Main St
- 341 Mccord St
- 238 Calhoun St
- 26788 E Main St
- 228 Mccord St
- 913 E Westbrook St
- 507 S Eshman Ave
- 184 Tournament St
- 1046 E Brame Ave
- 472 S Eshman Ave
- 105 Converse Dr
- 405 S Eshman Ave
- 44 Torbert Dr
- 123 Cottrell St
- 530 E Morrow St
- 33 Court
- 278 Converse Dr
- 939 E Westbrook St
- 587 E Westbrook St
- 931 E Westbrook St
- 575 E Westbrook St
- 575 E Westbrook
- 938 E Westbrook St
- 946 E Westbrook St
- 576 E Westbrook St
- 1180 E Broad St
- 930 E Westbrook St
- 954 E Westbrook St
- 940 E Broad St
- 915 E Westbrook St
- 645 E Westbrook St
- 963 E Westbrook St
- 944 E Broad St
- 920 E Westbrook St
- 962 E Westbrook St
- 962 E Westbrook St
- 319 Miller Ave
Your Personal Tour Guide
Ask me questions while you tour the home.