Estimated Value: $230,000 - $237,000
2
Beds
2
Baths
1,264
Sq Ft
$184/Sq Ft
Est. Value
About This Home
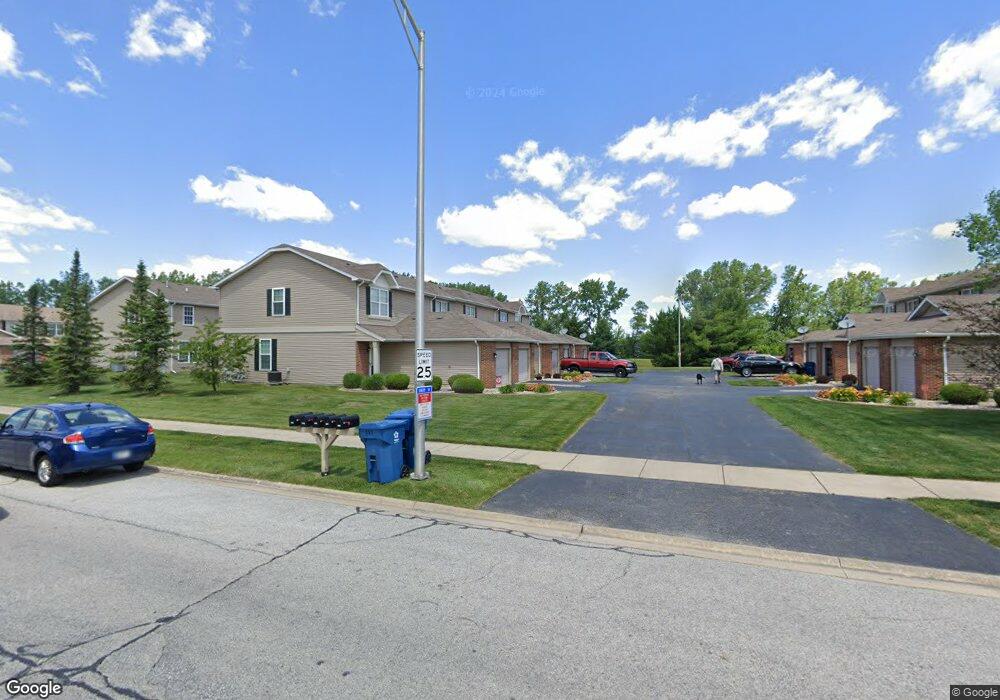
This home is located at 939 Flagstone Dr Unit 163-5, Dyer, IN 46311 and is currently estimated at $232,748, approximately $184 per square foot. 939 Flagstone Dr Unit 163-5 is a home located in Lake County with nearby schools including Kahler Middle School, Protsman Elementary School, and Lake Central High School.
Ownership History
Date
Name
Owned For
Owner Type
Purchase Details
Closed on
May 6, 2020
Sold by
Moriecz Richard L
Bought by
Cleek Jill
Current Estimated Value
Home Financials for this Owner
Home Financials are based on the most recent Mortgage that was taken out on this home.
Original Mortgage
$161,990
Outstanding Balance
$143,546
Interest Rate
3.3%
Mortgage Type
New Conventional
Estimated Equity
$89,202
Purchase Details
Closed on
Jul 3, 2012
Sold by
Perniciaro Ryan
Bought by
Orelik Richard M
Home Financials for this Owner
Home Financials are based on the most recent Mortgage that was taken out on this home.
Original Mortgage
$123,546
Interest Rate
3.64%
Mortgage Type
VA
Purchase Details
Closed on
Sep 12, 2006
Sold by
Rockwell Development Llc
Bought by
Perniciaro Ryan
Home Financials for this Owner
Home Financials are based on the most recent Mortgage that was taken out on this home.
Original Mortgage
$125,085
Interest Rate
6%
Mortgage Type
Unknown
Create a Home Valuation Report for This Property
The Home Valuation Report is an in-depth analysis detailing your home's value as well as a comparison with similar homes in the area
Home Values in the Area
Average Home Value in this Area
Purchase History
| Date | Buyer | Sale Price | Title Company |
|---|---|---|---|
| Cleek Jill | -- | Greater Indiana Title Co | |
| Orelik Richard M | -- | Community Title Company | |
| Perniciaro Ryan | -- | Ticor Title Schererville |
Source: Public Records
Mortgage History
| Date | Status | Borrower | Loan Amount |
|---|---|---|---|
| Open | Cleek Jill | $161,990 | |
| Previous Owner | Orelik Richard M | $123,546 | |
| Previous Owner | Perniciaro Ryan | $125,085 |
Source: Public Records
Tax History Compared to Growth
Tax History
| Year | Tax Paid | Tax Assessment Tax Assessment Total Assessment is a certain percentage of the fair market value that is determined by local assessors to be the total taxable value of land and additions on the property. | Land | Improvement |
|---|---|---|---|---|
| 2024 | $5,450 | $223,700 | $65,000 | $158,700 |
| 2023 | $2,042 | $214,300 | $65,000 | $149,300 |
| 2022 | $2,042 | $187,600 | $65,000 | $122,600 |
| 2021 | $1,714 | $168,000 | $35,000 | $133,000 |
| 2020 | $1,579 | $155,300 | $35,000 | $120,300 |
| 2019 | $1,586 | $145,700 | $35,000 | $110,700 |
| 2018 | $1,460 | $141,000 | $35,000 | $106,000 |
| 2017 | $1,327 | $138,600 | $35,000 | $103,600 |
| 2016 | $1,144 | $128,700 | $35,000 | $93,700 |
| 2014 | $1,110 | $132,600 | $35,000 | $97,600 |
| 2013 | $1,111 | $131,400 | $35,000 | $96,400 |
Source: Public Records
Map
Nearby Homes
- 1769 Autumn Ct
- 1039 Summertime Ct
- 1065 Flagstone Dr
- 1030 Rockwell Ln
- T-1415 Adler Plan at Parkside
- T-1647 Wren Plan at Parkside
- 1211 Joliet St
- 2308 Flint Ct
- 2316 Boulder Rd
- 2265 Sandcastle Dr
- 2264 Sandcastle Dr
- 1437 Madison Ave
- 511 Devon Dr
- 2325 Hickory Dr
- 1451 Joliet St
- 1932 Church St
- 2428 Rolling Hill Dr
- 1011 Arrowhead Dr
- 736 Cottonwood Dr
- 1514 Harrison Ave
- 939 Flagstone Dr
- 937 Flagstone Dr
- 937 Flagstone Dr Unit 163-4
- 935 Flagstone Dr
- 935 Flagstone Dr Unit 163-3
- 933 Flagstone Dr
- 931 Flagstone Dr Unit 163-1
- 919 Flagstone Dr
- 945 Flagstone Dr
- 917 Flagstone Dr
- 921 Flagstone Dr
- 921 Flagstone Dr Unit 164-3
- 947 Flagstone Dr
- 947 Flagstone Dr Unit 162-2
- 949 Flagstone Dr
- 949 Flagstone Dr Unit 162-3
- 923 Flagstone Dr Unit 1644
- 923 Flagstone Dr
- 951 Flagstone Dr
- 951 Flagstone Dr Unit 951