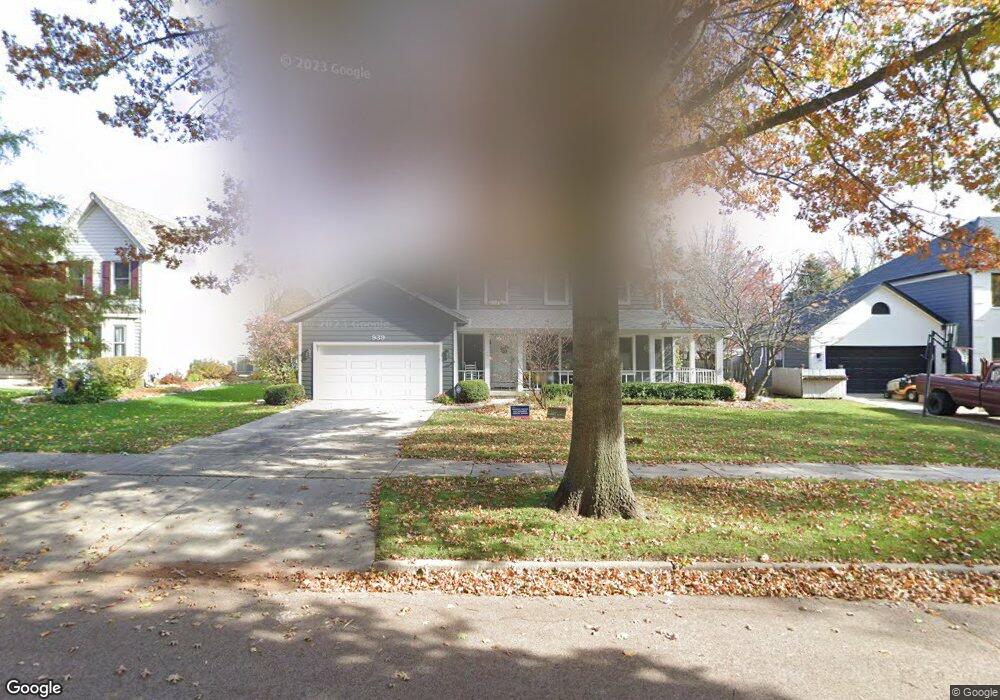
939 Glenmore Ln Elgin, IL 60124
Far West Elgin NeighborhoodEstimated Value: $433,000 - $495,000
4
Beds
3
Baths
2,345
Sq Ft
$195/Sq Ft
Est. Value
About This Home
This home is located at 939 Glenmore Ln, Elgin, IL 60124 and is currently estimated at $456,693, approximately $194 per square foot. 939 Glenmore Ln is a home located in Kane County with nearby schools including Creekside Elementary School, Kimball Middle School, and Larkin High School.
Ownership History
Date
Name
Owned For
Owner Type
Purchase Details
Closed on
Aug 18, 1999
Sold by
Wedemeyer David W and Wedemeyer Irene J
Bought by
Wedemeyer David W and Wedemeyer Irene A Jirka
Current Estimated Value
Create a Home Valuation Report for This Property
The Home Valuation Report is an in-depth analysis detailing your home's value as well as a comparison with similar homes in the area
Home Values in the Area
Average Home Value in this Area
Purchase History
| Date | Buyer | Sale Price | Title Company |
|---|---|---|---|
| Wedemeyer David W | -- | -- |
Source: Public Records
Tax History Compared to Growth
Tax History
| Year | Tax Paid | Tax Assessment Tax Assessment Total Assessment is a certain percentage of the fair market value that is determined by local assessors to be the total taxable value of land and additions on the property. | Land | Improvement |
|---|---|---|---|---|
| 2024 | $9,748 | $129,805 | $35,868 | $93,937 |
| 2023 | $9,315 | $117,269 | $32,404 | $84,865 |
| 2022 | $8,752 | $106,929 | $29,547 | $77,382 |
| 2021 | $8,384 | $99,971 | $27,624 | $72,347 |
| 2020 | $8,157 | $95,437 | $26,371 | $69,066 |
| 2019 | $7,930 | $90,910 | $25,120 | $65,790 |
| 2018 | $7,874 | $85,643 | $23,665 | $61,978 |
| 2017 | $7,710 | $80,963 | $22,372 | $58,591 |
| 2016 | $7,371 | $75,112 | $20,755 | $54,357 |
| 2015 | -- | $68,847 | $19,024 | $49,823 |
| 2014 | -- | $67,997 | $18,789 | $49,208 |
| 2013 | -- | $69,791 | $19,285 | $50,506 |
Source: Public Records
Map
Nearby Homes
- 908 Glenmore Ln
- 900 Glenmore Ln
- 660 Robin Ridge
- 519 Shagbark Dr
- 949 Millcreek Cir
- Lot 1 Highland Springs Dr
- 640 Highland Springs Dr
- 2214 Colorado Ave Unit 4
- 3316 Highwood Ct
- Geneva Plan at The Villas at Madison Lane
- 609 N Lyle Ave
- 691 Canyon Ln
- 3410 Cameron Dr Unit 34
- 2013 Jeffrey Ln Unit 2013
- 2705 Colonial Dr
- 910 Tipperary St
- 3500 Hopewell Place
- 731 Slate Run
- 1405 Creekside Ct Unit B
- 54 Meadows Dr
- 943 Glenmore Ln
- 935 Glenmore Ln
- 942 Stonehaven Ct
- 3621 Edelweiss Rd
- 3625 Edelweiss Rd
- 942 Stonehaven Ct
- 947 Glenmore Ln
- 931 Glenmore Ln
- 938 Stonehaven Ct
- 938 Glenmore Ln
- 946 Stonehaven Dr
- 942 Glenmore Ln
- 924 Stonehaven Dr
- 934 Glenmore Ln
- 951 Glenmore Ln
- 923 Glenmore Ln
- 946 Glenmore Ln
- 926 Stonehaven Dr
- 930 Glenmore Ln
- 934 Stonehaven Dr