Estimated Value: $262,000 - $477,000
3
Beds
2
Baths
1,296
Sq Ft
$269/Sq Ft
Est. Value
About This Home
This home is located at 939 Jim Rice Rd, Yreka, CA 96097 and is currently estimated at $349,000, approximately $269 per square foot. 939 Jim Rice Rd is a home located in Siskiyou County with nearby schools including Evergreen Elementary School, Jackson Street Elementary School, and Yreka High School.
Ownership History
Date
Name
Owned For
Owner Type
Purchase Details
Closed on
Nov 16, 2021
Sold by
Rice Teresa D
Bought by
Knapp Diana M
Current Estimated Value
Home Financials for this Owner
Home Financials are based on the most recent Mortgage that was taken out on this home.
Original Mortgage
$116,000
Interest Rate
3.85%
Mortgage Type
New Conventional
Purchase Details
Closed on
Sep 6, 2007
Sold by
Rice Teresa D and Knapp Diana M
Bought by
Rice Teresa D
Home Financials for this Owner
Home Financials are based on the most recent Mortgage that was taken out on this home.
Original Mortgage
$145,000
Interest Rate
6.57%
Mortgage Type
Stand Alone Refi Refinance Of Original Loan
Purchase Details
Closed on
Aug 1, 2007
Sold by
Rice Teresa D
Bought by
Rice Teresa D
Home Financials for this Owner
Home Financials are based on the most recent Mortgage that was taken out on this home.
Original Mortgage
$145,000
Interest Rate
6.57%
Mortgage Type
Stand Alone Refi Refinance Of Original Loan
Create a Home Valuation Report for This Property
The Home Valuation Report is an in-depth analysis detailing your home's value as well as a comparison with similar homes in the area
Home Values in the Area
Average Home Value in this Area
Purchase History
| Date | Buyer | Sale Price | Title Company |
|---|---|---|---|
| Knapp Diana M | -- | -- | |
| Rice Teresa D | -- | Mt Shasta Title & Escrow Co | |
| Rice Teresa D | -- | Mt Shasta Title & Escrow Co | |
| Rice Teresa D | -- | None Available |
Source: Public Records
Mortgage History
| Date | Status | Borrower | Loan Amount |
|---|---|---|---|
| Previous Owner | Knapp Diana M | $116,000 | |
| Previous Owner | Rice Teresa D | $145,000 |
Source: Public Records
Tax History Compared to Growth
Tax History
| Year | Tax Paid | Tax Assessment Tax Assessment Total Assessment is a certain percentage of the fair market value that is determined by local assessors to be the total taxable value of land and additions on the property. | Land | Improvement |
|---|---|---|---|---|
| 2025 | $1,551 | $150,337 | $19,614 | $130,723 |
| 2023 | $1,551 | $144,501 | $18,853 | $125,648 |
| 2022 | $1,492 | $141,669 | $18,484 | $123,185 |
| 2021 | $1,467 | $138,892 | $18,122 | $120,770 |
| 2020 | $1,457 | $137,469 | $17,937 | $119,532 |
| 2019 | $1,432 | $134,775 | $17,586 | $117,189 |
| 2018 | $1,404 | $132,134 | $17,242 | $114,892 |
| 2017 | $1,378 | $129,544 | $16,904 | $112,640 |
| 2016 | $1,347 | $127,005 | $16,573 | $110,432 |
| 2015 | $1,327 | $125,099 | $16,325 | $108,774 |
| 2014 | $1,280 | $122,650 | $16,006 | $106,644 |
Source: Public Records
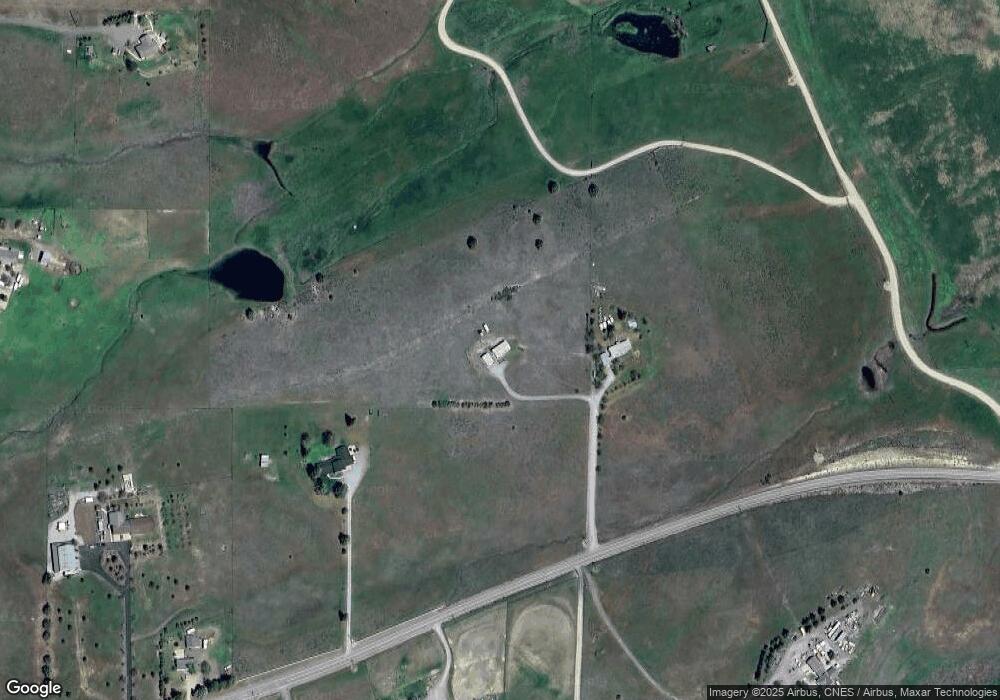
Map
Nearby Homes
- 1815 Hill Cummins Ln
- 10 acres Riverview Dr
- 0 Watson Ct Unit 20220752
- 1834 E State Hwy 3
- 704 S Phillipe Ln
- Lot 35 Watson Ct
- 2845 Watson Ct
- Lot 34 Watson Ct
- 1251-1323 N Foothill Dr
- 3315 Montague Rd
- 1010 Deer Creek Way
- 1439 Hawkinsville Humbug Rd
- 4204 State Highway 263
- 00 Montauge Rd Hwy 263
- 535 Spring St
- 548 N Main Street 547 Spring St
- 00 Tebbe St
- 404 N Main St
- 336 3rd St
- 0 Pine St Unit 20240671
- 1805 Yreka Ager Rd
- 1838 Yreka Ager Rd
- 1625 Yreka Ager Rd
- 1934 Yreka Ager Rd
- 2215 Yreka Ager Rd
- 1709 Yreka Ager Rd
- 1806 Riverview Dr
- 1936 Yreka Ager Rd
- 1738 Yreka Ager Rd
- 1812 Riverview Dr
- 1716 Yreka Ager Rd
- 1810 Riverview Dr
- 1604 Yreka Ager Rd
- 1524 Yreka Ager Rd
- 304 Fiock Rd
- 412 Riverview Dr
- 2219 Yreka Ager Rd
- 1405 Yreka Ager Rd
- XXXX Riverview
- 00000 Riverview Dr