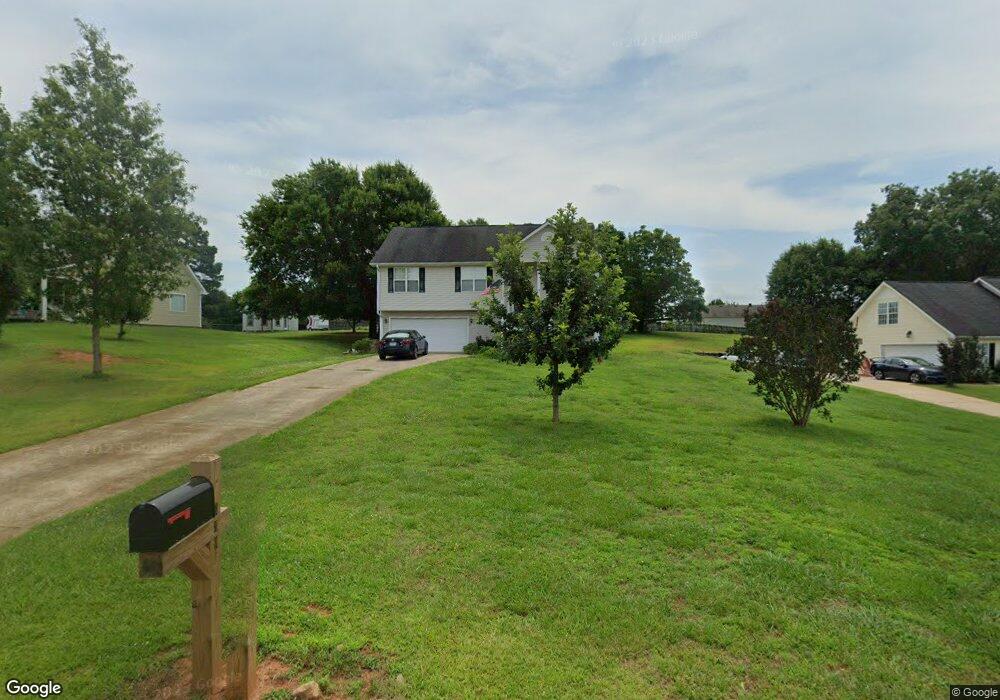
939 Justin Dr Unit 3 Winder, GA 30680
Estimated Value: $324,000 - $349,000
--
Bed
3
Baths
1,722
Sq Ft
$195/Sq Ft
Est. Value
About This Home
This home is located at 939 Justin Dr Unit 3, Winder, GA 30680 and is currently estimated at $335,639, approximately $194 per square foot. 939 Justin Dr Unit 3 is a home located in Barrow County with nearby schools including Holsenbeck Elementary School, Bear Creek Middle School, and Winder-Barrow High School.
Ownership History
Date
Name
Owned For
Owner Type
Purchase Details
Closed on
Feb 17, 2005
Sold by
Fannie Mae
Bought by
Bennett Rebecca I
Current Estimated Value
Home Financials for this Owner
Home Financials are based on the most recent Mortgage that was taken out on this home.
Original Mortgage
$96,500
Outstanding Balance
$48,468
Interest Rate
5.57%
Mortgage Type
New Conventional
Estimated Equity
$287,171
Purchase Details
Closed on
Dec 7, 2004
Sold by
Bank Of America
Bought by
Fedl Natl Mtg Assn
Purchase Details
Closed on
Mar 20, 2001
Sold by
Barber Kyle L
Bought by
Martin Daniel A
Home Financials for this Owner
Home Financials are based on the most recent Mortgage that was taken out on this home.
Original Mortgage
$114,363
Interest Rate
6.99%
Mortgage Type
New Conventional
Purchase Details
Closed on
Dec 8, 2000
Sold by
Patterson Ray and Patterson Bren
Bought by
Baber Kyle
Purchase Details
Closed on
May 22, 1980
Bought by
Patterson Ray and Patterson Bren
Create a Home Valuation Report for This Property
The Home Valuation Report is an in-depth analysis detailing your home's value as well as a comparison with similar homes in the area
Home Values in the Area
Average Home Value in this Area
Purchase History
| Date | Buyer | Sale Price | Title Company |
|---|---|---|---|
| Bennett Rebecca I | -- | -- | |
| Fedl Natl Mtg Assn | -- | -- | |
| Bank Of America | $109,657 | -- | |
| Martin Daniel A | $117,900 | -- | |
| Baber Kyle | $18,000 | -- | |
| Patterson Ray | -- | -- |
Source: Public Records
Mortgage History
| Date | Status | Borrower | Loan Amount |
|---|---|---|---|
| Open | Bennett Rebecca I | $96,500 | |
| Previous Owner | Martin Daniel A | $114,363 |
Source: Public Records
Tax History Compared to Growth
Tax History
| Year | Tax Paid | Tax Assessment Tax Assessment Total Assessment is a certain percentage of the fair market value that is determined by local assessors to be the total taxable value of land and additions on the property. | Land | Improvement |
|---|---|---|---|---|
| 2024 | $2,491 | $101,990 | $24,000 | $77,990 |
| 2023 | $1,625 | $83,392 | $18,000 | $65,392 |
| 2022 | $1,821 | $64,784 | $16,000 | $48,784 |
| 2021 | $1,915 | $64,784 | $16,000 | $48,784 |
| 2020 | $1,916 | $64,784 | $16,000 | $48,784 |
| 2019 | $1,949 | $64,784 | $16,000 | $48,784 |
| 2018 | $1,739 | $58,680 | $12,000 | $46,680 |
| 2017 | $1,315 | $45,147 | $12,000 | $33,147 |
| 2016 | $1,306 | $45,523 | $12,000 | $33,523 |
| 2015 | $1,312 | $45,523 | $12,000 | $33,523 |
| 2014 | $1,147 | $39,780 | $5,880 | $33,900 |
| 2013 | -- | $38,134 | $5,880 | $32,254 |
Source: Public Records
Map
Nearby Homes
- 1206 Corkybrooke Ln
- 917 Justin Dr Unit 3
- 388 Kay Dr Unit 1
- 1212 Highway 211 NE
- 1226 Highway 211 NE
- 1553 Shoal Creek Dr
- 1556 Shoal Creek Dr
- 508 Pleasant Hill Church Rd NE
- 330 Anchors Way
- 867 Windward Rd
- 130 (Tract 1) Bowman Mill Rd NE
- 130 Bowman Mill Rd NE Unit 1
- 212 Rainbow Ln
- 0 Hancock Bridge Rd Unit 10535063
- 385 Finch Landing Rd
- 63 Delightful Way Unit 1
- 1431 Solomon Dr
- 162 Delightful Way Unit 28
- 1023 Solomon Ct
- 203 Delightful Way Unit 5
- 941 Justin Dr Unit 3
- 937 Justin Dr
- 935 Justin Dr Unit 3
- 943 Justin Dr
- 940 Justin Dr Unit 3
- 1176 Highway 211 NE
- 936 Justin Dr Unit 3
- 942 Justin Dr Unit 3
- 1203 Corky Brooke Ln
- 944 Justin Dr
- 1162 Highway 211 NE
- 1023 Cook Rd
- 1203 Corkybrooke Ln
- 933 Justin Dr Unit 19
- 934 Justin Dr
- 1204 Corkybrooke Ln Unit 3
- 1038 Cook Rd
- 1205 Corky Brooke Ln
- 1205 Corkybrooke Ln
- 0 Cooks Rd Unit 2800824