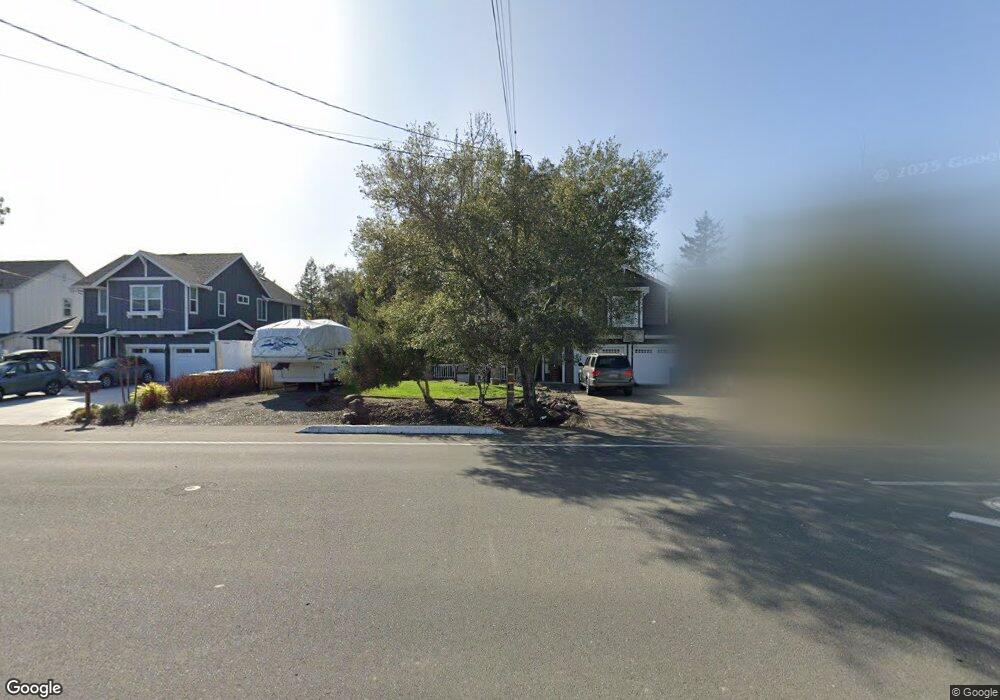
939 Middle Rincon Rd Santa Rosa, CA 95409
Estimated Value: $812,000 - $958,000
3
Beds
2
Baths
2,204
Sq Ft
$391/Sq Ft
Est. Value
About This Home
This home is located at 939 Middle Rincon Rd, Santa Rosa, CA 95409 and is currently estimated at $861,054, approximately $390 per square foot. 939 Middle Rincon Rd is a home located in Sonoma County with nearby schools including Rincon Valley Middle School, Maria Carrillo High School, and Santa Rosa Accelerated Charter School.
Ownership History
Date
Name
Owned For
Owner Type
Purchase Details
Closed on
Oct 2, 2011
Sold by
Wells Fargo Bank N A
Bought by
Gorauskas Leonardo G and Gorauskas Kimberly Ann
Current Estimated Value
Home Financials for this Owner
Home Financials are based on the most recent Mortgage that was taken out on this home.
Original Mortgage
$270,300
Outstanding Balance
$183,910
Interest Rate
4.05%
Mortgage Type
New Conventional
Estimated Equity
$677,144
Purchase Details
Closed on
Jul 14, 2011
Sold by
Pegram John D and Pegram Catherine D
Bought by
Wells Fargo Bank N A
Purchase Details
Closed on
Aug 10, 2006
Sold by
Bassignani Craig Maurice and Bassignani Cheryl Jean
Bought by
Pegram John and Pegram Catherine
Home Financials for this Owner
Home Financials are based on the most recent Mortgage that was taken out on this home.
Original Mortgage
$35,500
Interest Rate
6.7%
Mortgage Type
Unknown
Create a Home Valuation Report for This Property
The Home Valuation Report is an in-depth analysis detailing your home's value as well as a comparison with similar homes in the area
Purchase History
| Date | Buyer | Sale Price | Title Company |
|---|---|---|---|
| Gorauskas Leonardo G | $450,500 | Landsafe Title Of California | |
| Wells Fargo Bank N A | $435,479 | Accommodation | |
| Pegram John | $710,000 | First American Title Company |
Source: Public Records
Mortgage History
| Date | Status | Borrower | Loan Amount |
|---|---|---|---|
| Open | Gorauskas Leonardo G | $270,300 | |
| Previous Owner | Pegram John | $35,500 | |
| Previous Owner | Pegram John | $568,000 |
Source: Public Records
Tax History
| Year | Tax Paid | Tax Assessment Tax Assessment Total Assessment is a certain percentage of the fair market value that is determined by local assessors to be the total taxable value of land and additions on the property. | Land | Improvement |
|---|---|---|---|---|
| 2025 | $6,529 | $565,842 | $226,084 | $339,758 |
| 2024 | $6,529 | $554,748 | $221,651 | $333,097 |
| 2023 | $6,529 | $543,871 | $217,305 | $326,566 |
| 2022 | $6,030 | $533,208 | $213,045 | $320,163 |
| 2021 | $5,909 | $522,754 | $208,868 | $313,886 |
| 2020 | $5,887 | $517,395 | $206,727 | $310,668 |
| 2019 | $5,832 | $507,251 | $202,674 | $304,577 |
| 2018 | $5,795 | $497,305 | $198,700 | $298,605 |
| 2017 | $5,689 | $487,554 | $194,804 | $292,750 |
| 2016 | $5,628 | $477,995 | $190,985 | $287,010 |
| 2015 | $5,426 | $470,816 | $188,117 | $282,699 |
| 2014 | $5,261 | $461,595 | $184,433 | $277,162 |
Source: Public Records
Map
Nearby Homes
- 4306 Cox Ct
- 4301 Fistor Dr
- 4500 Fistor Dr
- 59 Redwood Ct
- 4305 Fistor Dr
- 2492 Plum Meadow Ct
- 2490 Creek Meadow Dr
- 0 Bridgewood Dr
- 2336 Greenbriar Way
- 6334 Bridgewood Dr
- 2309 Parkwood Ct
- 645 Speers Rd
- 6900 Montecito Blvd
- 2703 Brush Creek Rd
- 103 Glenoak Ct
- 5779 Trailwood Dr
- 91 Greenrock Ct
- 173 Brookview Ct
- 172 Brookview Ct
- 2127 Fremont Dr
- 937 Middle Rincon Rd
- 943 Middle Rincon Rd
- 931 Middle Rincon Rd
- 929 Middle Rincon Rd
- 820 Zimmerman Ln
- 4765 Perezoso Calle
- 4628 Badger Rd
- 928 Middle Rincon Rd
- 947 Middle Rincon Rd
- 915 Middle Rincon Rd
- 924 Middle Rincon Rd
- 4769 Perezoso Calle
- 4769 Perezoso Calle Unkn
- 4768 Perezoso Calle
- 4620 Badger Rd
- 920 Middle Rincon Rd
- 927 Middle Rincon Rd
- 4630 Badger Rd
- 4773 Perezoso Calle
- 931 Tranquilo Calle
Your Personal Tour Guide
Ask me questions while you tour the home.