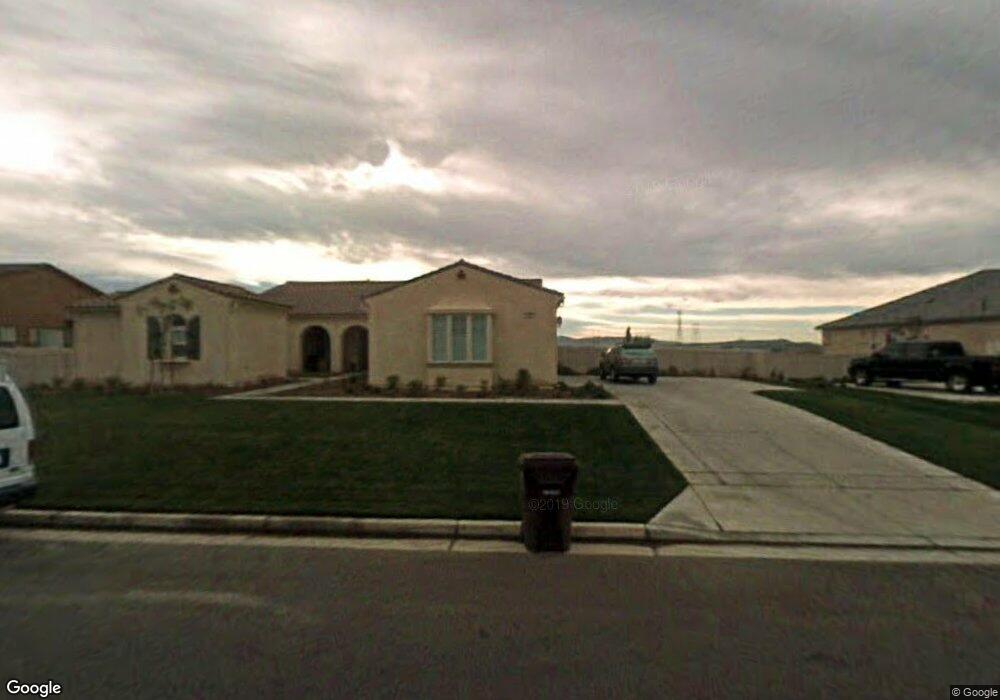
939 Union St Cherry Valley, CA 92223
Estimated Value: $802,000 - $1,035,000
4
Beds
4
Baths
3,085
Sq Ft
$302/Sq Ft
Est. Value
About This Home
This home is located at 939 Union St, Cherry Valley, CA 92223 and is currently estimated at $932,623, approximately $302 per square foot. 939 Union St is a home located in Riverside County with nearby schools including Brookside Elementary School, Mountain View Middle School, and Beaumont Senior High School.
Ownership History
Date
Name
Owned For
Owner Type
Purchase Details
Closed on
May 10, 2018
Sold by
Munar Nadia Lynn and Munar Patrick E
Bought by
Munar Nadia Lynn and Munar Patrick E
Current Estimated Value
Purchase Details
Closed on
Nov 14, 2006
Sold by
Pulte Home Corp
Bought by
Munar Patrick E and Balquiedra Nadia Lynn
Home Financials for this Owner
Home Financials are based on the most recent Mortgage that was taken out on this home.
Original Mortgage
$61,939
Outstanding Balance
$36,658
Interest Rate
6.22%
Mortgage Type
Stand Alone Second
Estimated Equity
$895,965
Create a Home Valuation Report for This Property
The Home Valuation Report is an in-depth analysis detailing your home's value as well as a comparison with similar homes in the area
Home Values in the Area
Average Home Value in this Area
Purchase History
| Date | Buyer | Sale Price | Title Company |
|---|---|---|---|
| Munar Nadia Lynn | -- | None Available | |
| Munar Patrick E | $619,500 | First American Title Company |
Source: Public Records
Mortgage History
| Date | Status | Borrower | Loan Amount |
|---|---|---|---|
| Open | Munar Patrick E | $61,939 |
Source: Public Records
Tax History
| Year | Tax Paid | Tax Assessment Tax Assessment Total Assessment is a certain percentage of the fair market value that is determined by local assessors to be the total taxable value of land and additions on the property. | Land | Improvement |
|---|---|---|---|---|
| 2025 | $12,750 | $836,416 | $221,053 | $615,363 |
| 2023 | $12,750 | $803,939 | $212,470 | $591,469 |
| 2022 | $12,525 | $788,176 | $208,304 | $579,872 |
| 2021 | $11,299 | $695,851 | $119,974 | $575,877 |
| 2020 | $10,317 | $621,296 | $107,120 | $514,176 |
| 2019 | $10,098 | $603,200 | $104,000 | $499,200 |
| 2018 | $9,924 | $580,000 | $100,000 | $480,000 |
| 2017 | $9,959 | $580,000 | $100,000 | $480,000 |
| 2016 | $10,241 | $580,000 | $100,000 | $480,000 |
| 2015 | $9,684 | $540,000 | $100,000 | $440,000 |
| 2014 | $6,475 | $336,000 | $89,000 | $247,000 |
Source: Public Records
Map
Nearby Homes
- 1791 Hannon Rd
- 1776 Desert Almond Way
- 951 Essex Rd
- 1732 Brittney Rd
- 1140 Lantana Rd
- 1746 Dalea Way
- 1725 Scottsdale Rd
- 10820 Hannon Rd
- 979 Ironwood Rd
- 973 Ironwood Rd
- 1143 Saguaro Rd
- 883 Eastlake Rd
- 1771 N Forest Oaks Dr
- 1587 Summerlin Ct
- 1566 High Meadow Dr
- 949 Pebble Beach Rd
- 1591 Castle Pines Ln
- 1577 Valhalla Ct
- 860 Annandale Rd
- 930 Gleneagles Rd
Your Personal Tour Guide
Ask me questions while you tour the home.