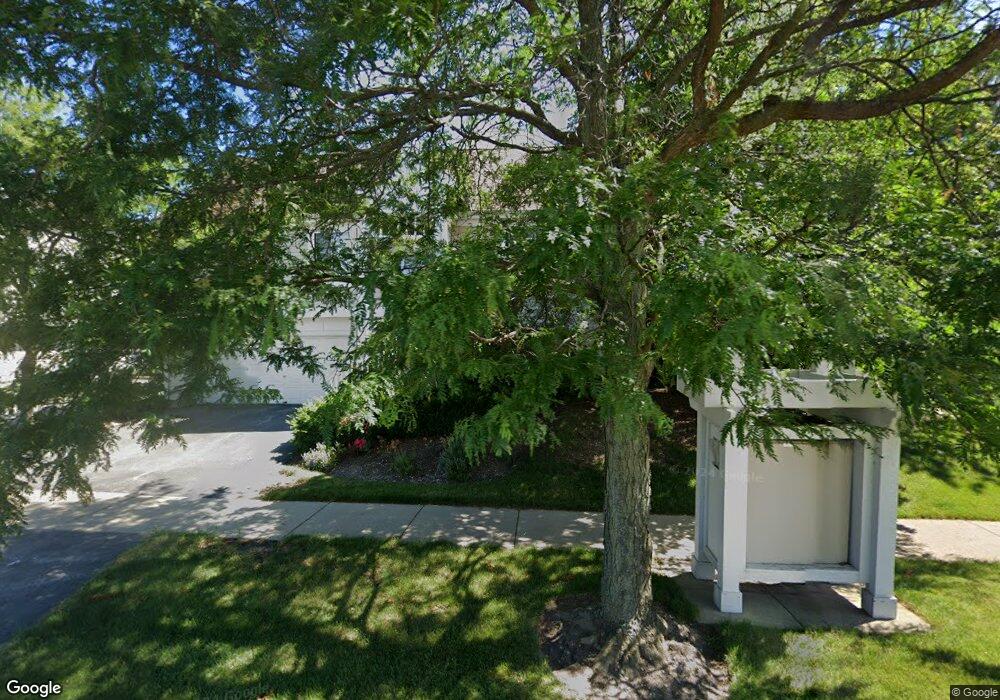
9393 Harrison St Unit 171393 Des Plaines, IL 60016
Estimated Value: $290,000 - $403,000
--
Bed
--
Bath
--
Sq Ft
5.46
Acres
About This Home
This home is located at 9393 Harrison St Unit 171393, Des Plaines, IL 60016 and is currently estimated at $349,588. 9393 Harrison St Unit 171393 is a home located in Cook County with nearby schools including Apollo Elementary School, Gemini Middle School, and Maine East High School.
Ownership History
Date
Name
Owned For
Owner Type
Purchase Details
Closed on
Jul 29, 2003
Sold by
Zisman Gloria
Bought by
Zisman Gloria and Zisman Greg
Current Estimated Value
Home Financials for this Owner
Home Financials are based on the most recent Mortgage that was taken out on this home.
Original Mortgage
$190,000
Interest Rate
5.97%
Mortgage Type
Unknown
Purchase Details
Closed on
Oct 18, 1999
Sold by
Park Jin Ju
Bought by
Zisman Gloria
Home Financials for this Owner
Home Financials are based on the most recent Mortgage that was taken out on this home.
Original Mortgage
$159,600
Interest Rate
7.75%
Purchase Details
Closed on
Nov 7, 1996
Sold by
Capri Llc
Bought by
Park Jin Ju
Home Financials for this Owner
Home Financials are based on the most recent Mortgage that was taken out on this home.
Original Mortgage
$144,000
Interest Rate
7.6%
Create a Home Valuation Report for This Property
The Home Valuation Report is an in-depth analysis detailing your home's value as well as a comparison with similar homes in the area
Home Values in the Area
Average Home Value in this Area
Purchase History
| Date | Buyer | Sale Price | Title Company |
|---|---|---|---|
| Zisman Gloria | -- | Atgf Inc | |
| Zisman Gloria | $199,500 | -- | |
| Park Jin Ju | $180,500 | Ticor Title Insurance |
Source: Public Records
Mortgage History
| Date | Status | Borrower | Loan Amount |
|---|---|---|---|
| Closed | Zisman Gloria | $190,000 | |
| Closed | Zisman Gloria | $159,600 | |
| Previous Owner | Park Jin Ju | $144,000 |
Source: Public Records
Tax History Compared to Growth
Tax History
| Year | Tax Paid | Tax Assessment Tax Assessment Total Assessment is a certain percentage of the fair market value that is determined by local assessors to be the total taxable value of land and additions on the property. | Land | Improvement |
|---|---|---|---|---|
| 2024 | $5,978 | $26,341 | $1,850 | $24,491 |
| 2023 | $5,657 | $26,341 | $1,850 | $24,491 |
| 2022 | $5,657 | $26,341 | $1,850 | $24,491 |
| 2021 | $2,569 | $11,878 | $2,845 | $9,033 |
| 2020 | $2,578 | $11,878 | $2,845 | $9,033 |
| 2019 | $2,529 | $13,222 | $2,845 | $10,377 |
| 2018 | $4,338 | $18,246 | $2,489 | $15,757 |
| 2017 | $4,283 | $18,246 | $2,489 | $15,757 |
| 2016 | $4,236 | $18,246 | $2,489 | $15,757 |
| 2015 | $5,625 | $21,768 | $2,134 | $19,634 |
| 2014 | $5,450 | $21,768 | $2,134 | $19,634 |
| 2013 | $5,339 | $21,768 | $2,134 | $19,634 |
Source: Public Records
Map
Nearby Homes
- 9411 Harrison St Unit 471494
- 10009 Meadow Ln
- 9330 Hamilton Ct Unit E
- 9821 Bianco Terrace Unit A
- 10151 Meadow Ln
- 9724 Bianco Terrace Unit A
- 9701 N Dee Rd Unit 5F
- 9701 N Dee Rd Unit 2I
- 9078 W Heathwood Dr Unit 1M
- 9128 W Terrace Dr Unit 2N
- 9517 W Central Rd
- 9630 Reding Cir
- 625 Quincy Bridge Ln Unit 301
- 4150 Central Rd Unit 3E
- 9098 W Terrace Dr Unit 1L
- 9074 W Terrace Dr Unit 4N
- 9600 S Lyman Ave
- 600 Naples Ct Unit 107
- 600 Naples Ct Unit 608
- 701 Forum Square Unit 609
- 9395 Harrison St Unit 271493
- 9399 Harrison St Unit 471493
- 9399 Harrison St Unit 9399
- 9401 Harrison St Unit 571494
- 9413 Harrison St Unit 571494
- 9415 Harrison St Unit 671394
- 9391 Harrison St Unit 671393
- 9389 Harrison St Unit 571493
- 9403 Harrison St Unit 671494
- 9411 Harrison St
- 9387 Harrison St Unit 471493
- 9409 Harrison St Unit 371494
- 9385 Harrison St Unit 371493
- 9407 Harrison St Unit 271494
- 9383 Harrison St Unit 271493
- 9381 Harrison St Unit 171493
- 9381 Harrison St Unit 9381
- 9405 Harrison St Unit 171494
- 9405 Harrison St