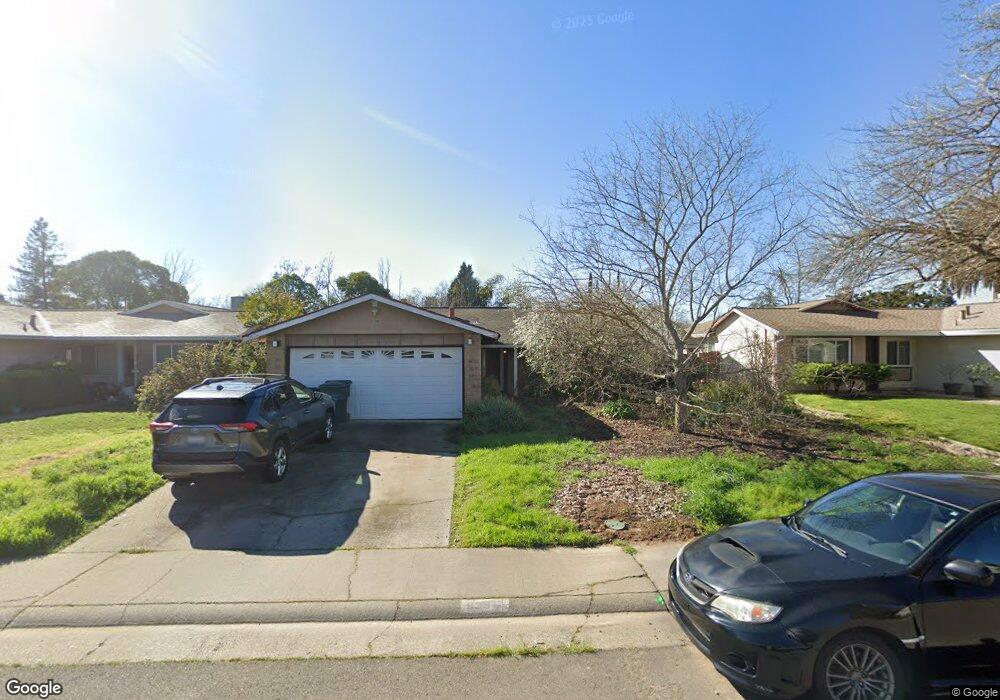
9396 Snowbird Way Sacramento, CA 95826
Rosemont NeighborhoodEstimated Value: $450,970 - $494,000
3
Beds
2
Baths
1,292
Sq Ft
$365/Sq Ft
Est. Value
About This Home
This home is located at 9396 Snowbird Way, Sacramento, CA 95826 and is currently estimated at $471,993, approximately $365 per square foot. 9396 Snowbird Way is a home located in Sacramento County with nearby schools including James Marshall Elementary School, Albert Einstein Middle School, and Rosemont High School.
Ownership History
Date
Name
Owned For
Owner Type
Purchase Details
Closed on
Oct 24, 2001
Sold by
Reeder Eileen M and The Eileen M Reeder Trust
Bought by
Anderson Scott J and Reeder Eileen M
Current Estimated Value
Home Financials for this Owner
Home Financials are based on the most recent Mortgage that was taken out on this home.
Original Mortgage
$100,000
Outstanding Balance
$39,086
Interest Rate
6.87%
Estimated Equity
$432,907
Purchase Details
Closed on
Jun 30, 2000
Sold by
Reeder Eileen M
Bought by
Reeder Eileen M and Eileen M Reeder Trust
Purchase Details
Closed on
May 10, 1994
Sold by
Critelli James J and Critelli Mary E
Bought by
Reeder Bernice L and Reeder Eileen M
Home Financials for this Owner
Home Financials are based on the most recent Mortgage that was taken out on this home.
Original Mortgage
$91,200
Interest Rate
3.87%
Create a Home Valuation Report for This Property
The Home Valuation Report is an in-depth analysis detailing your home's value as well as a comparison with similar homes in the area
Home Values in the Area
Average Home Value in this Area
Purchase History
| Date | Buyer | Sale Price | Title Company |
|---|---|---|---|
| Anderson Scott J | -- | Chicago Title Co | |
| Reeder Eileen M | -- | -- | |
| Reeder Bernice L | $114,000 | Founders Title Company |
Source: Public Records
Mortgage History
| Date | Status | Borrower | Loan Amount |
|---|---|---|---|
| Open | Anderson Scott J | $100,000 | |
| Closed | Reeder Bernice L | $91,200 |
Source: Public Records
Tax History Compared to Growth
Tax History
| Year | Tax Paid | Tax Assessment Tax Assessment Total Assessment is a certain percentage of the fair market value that is determined by local assessors to be the total taxable value of land and additions on the property. | Land | Improvement |
|---|---|---|---|---|
| 2025 | $2,286 | $193,730 | $76,467 | $117,263 |
| 2024 | $2,286 | $189,932 | $74,968 | $114,964 |
| 2023 | $2,231 | $186,209 | $73,499 | $112,710 |
| 2022 | $2,190 | $182,558 | $72,058 | $110,500 |
| 2021 | $2,088 | $178,980 | $70,646 | $108,334 |
| 2020 | $2,103 | $177,146 | $69,922 | $107,224 |
| 2019 | $2,056 | $173,673 | $68,551 | $105,122 |
| 2018 | $2,002 | $170,268 | $67,207 | $103,061 |
| 2017 | $1,973 | $166,931 | $65,890 | $101,041 |
| 2016 | $1,883 | $163,659 | $64,599 | $99,060 |
| 2015 | $1,855 | $161,202 | $63,629 | $97,573 |
| 2014 | $1,803 | $158,045 | $62,383 | $95,662 |
Source: Public Records
Map
Nearby Homes
- 3520 Contempo Dr
- 9372 Snowbird Way
- 3606 Gold Creek Ln
- 3620 Gold Creek Ln
- 3622 Gold Creek Ln
- 9436 Bravo Way
- 3308 Eclipse Ct
- 3652 Pullman Dr
- 3105 Brasilia Ct
- 9562 Harvest Gold Ct
- 3424 Pageant Dr
- 3404 Pageant Dr
- 9380 Mirandy Dr
- 9421 Williamette Way
- 3787 Station St
- 1684SCV 1684 Plan at Stone Creek Village - Veranda
- 1923SCV 1923 Plan at Stone Creek Village - Veranda
- 1542SCV 1542 Plan at Stone Creek Village - Veranda
- 1452SCV 1452 Plan at Stone Creek Village - Veranda
- 3312 Eisenhower Dr
- 9400 Snowbird Way
- 9392 Snowbird Way
- 9395 Americana Way
- 9391 Americana Way
- 9401 Americana Way
- 9388 Snowbird Way
- 9397 Snowbird Way
- 9405 Americana Way
- 9401 Snowbird Way
- 9393 Snowbird Way
- 9387 Americana Way
- 9384 Snowbird Way
- 9389 Snowbird Way
- 9405 Snowbird Way
- 9383 Americana Way
- 9385 Snowbird Way
- 3501 Blue River Ct
- 9380 Snowbird Way
- 9428 Americana Way