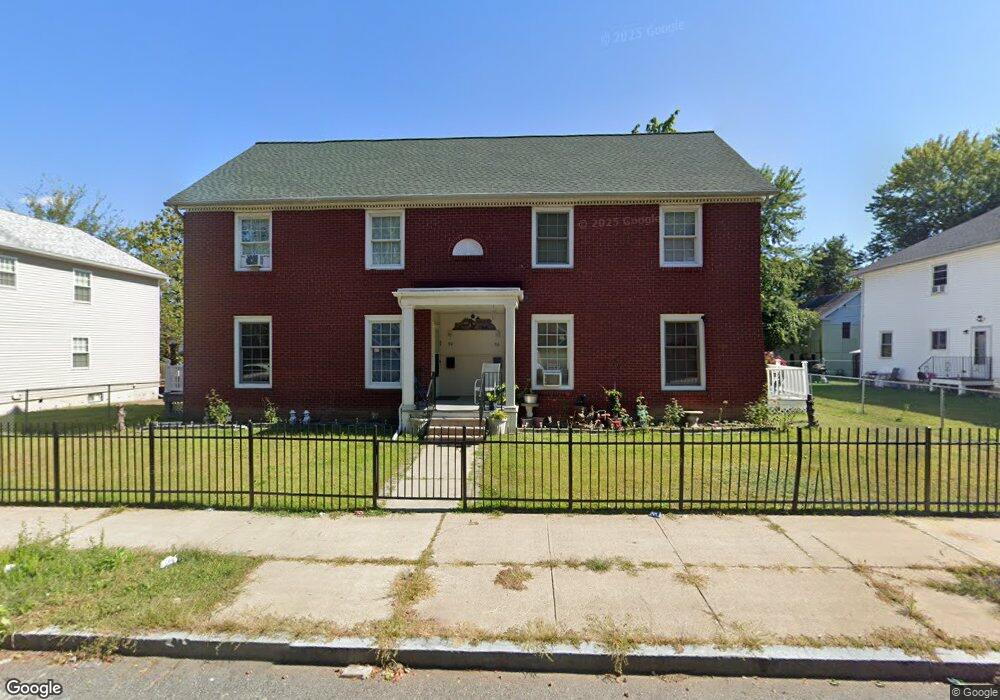
94 Beech St Unit 96 Holyoke, MA 01040
Estimated Value: $325,000 - $445,000
6
Beds
4
Baths
2,665
Sq Ft
$147/Sq Ft
Est. Value
About This Home
This home is located at 94 Beech St Unit 96, Holyoke, MA 01040 and is currently estimated at $390,694, approximately $146 per square foot. 94 Beech St Unit 96 is a home located in Hampden County with nearby schools including Kelly Elementary School, Holyoke High School, and Mater Dolorosa Elementary School.
Ownership History
Date
Name
Owned For
Owner Type
Purchase Details
Closed on
Jul 23, 2004
Sold by
Olde Holyoke Dev
Bought by
Rodriguez Nery and Rodriguez Pedro
Current Estimated Value
Home Financials for this Owner
Home Financials are based on the most recent Mortgage that was taken out on this home.
Original Mortgage
$90,155
Outstanding Balance
$45,217
Interest Rate
6.28%
Mortgage Type
Purchase Money Mortgage
Estimated Equity
$345,477
Create a Home Valuation Report for This Property
The Home Valuation Report is an in-depth analysis detailing your home's value as well as a comparison with similar homes in the area
Home Values in the Area
Average Home Value in this Area
Purchase History
| Date | Buyer | Sale Price | Title Company |
|---|---|---|---|
| Rodriguez Nery | $94,900 | -- |
Source: Public Records
Mortgage History
| Date | Status | Borrower | Loan Amount |
|---|---|---|---|
| Open | Rodriguez Nery | $90,155 |
Source: Public Records
Tax History Compared to Growth
Tax History
| Year | Tax Paid | Tax Assessment Tax Assessment Total Assessment is a certain percentage of the fair market value that is determined by local assessors to be the total taxable value of land and additions on the property. | Land | Improvement |
|---|---|---|---|---|
| 2025 | $6,612 | $378,700 | $37,100 | $341,600 |
| 2024 | $6,051 | $319,300 | $35,200 | $284,100 |
| 2023 | $5,547 | $295,700 | $35,200 | $260,500 |
| 2022 | $5,564 | $288,900 | $35,200 | $253,700 |
| 2021 | $4,862 | $252,300 | $33,000 | $219,300 |
| 2020 | $4,488 | $235,200 | $33,000 | $202,200 |
| 2019 | $4,379 | $227,000 | $30,000 | $197,000 |
| 2018 | $4,079 | $213,200 | $30,000 | $183,200 |
| 2017 | $4,087 | $213,200 | $30,000 | $183,200 |
| 2016 | $3,948 | $206,500 | $28,400 | $178,100 |
| 2015 | $3,932 | $206,500 | $28,400 | $178,100 |
Source: Public Records
Map
Nearby Homes