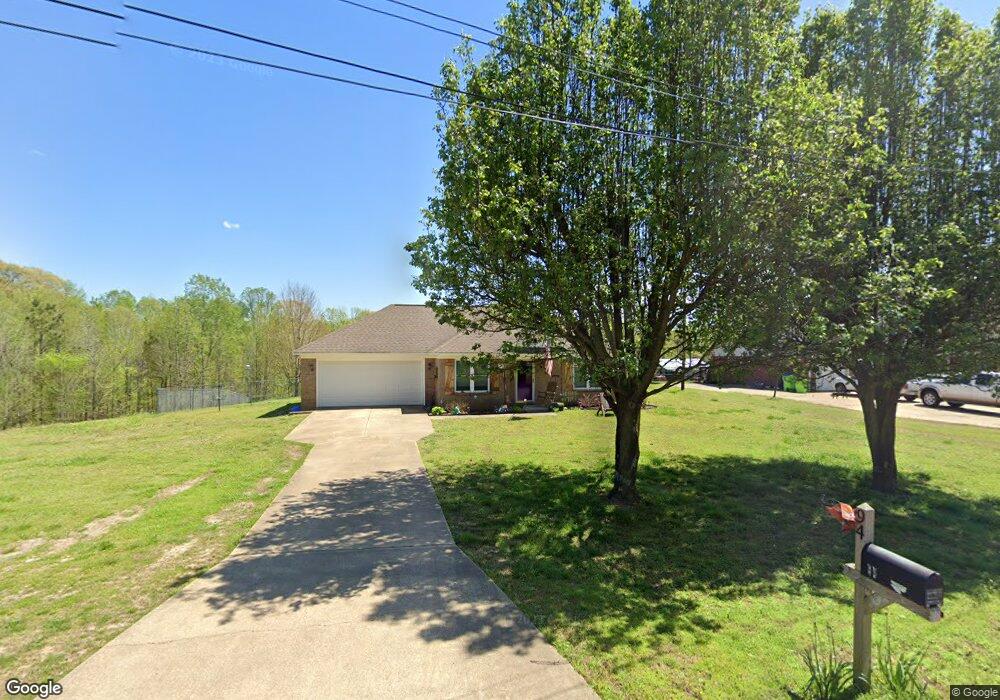
94 Craig Rd Millington, TN 38053
Estimated Value: $241,194 - $266,000
3
Beds
2
Baths
1,322
Sq Ft
$193/Sq Ft
Est. Value
About This Home
This home is located at 94 Craig Rd, Millington, TN 38053 and is currently estimated at $255,299, approximately $193 per square foot. 94 Craig Rd is a home located in Tipton County with nearby schools including Drummonds Elementary School, Munford Middle School, and Munford High School.
Ownership History
Date
Name
Owned For
Owner Type
Purchase Details
Closed on
May 13, 2009
Sold by
Garzonio Jason M
Bought by
Kahler William
Current Estimated Value
Home Financials for this Owner
Home Financials are based on the most recent Mortgage that was taken out on this home.
Original Mortgage
$134,693
Outstanding Balance
$84,919
Interest Rate
4.81%
Estimated Equity
$170,380
Purchase Details
Closed on
Jul 1, 2003
Sold by
Garzonio Jason M
Bought by
Garzonio Jason M
Home Financials for this Owner
Home Financials are based on the most recent Mortgage that was taken out on this home.
Original Mortgage
$93,000
Interest Rate
5.43%
Purchase Details
Closed on
Oct 9, 2000
Sold by
Norton Roy D
Bought by
Garzonio Jason M
Purchase Details
Closed on
Jun 7, 1999
Sold by
Craig F O
Bought by
Norton Roy D
Home Financials for this Owner
Home Financials are based on the most recent Mortgage that was taken out on this home.
Original Mortgage
$82,500
Interest Rate
7.04%
Purchase Details
Closed on
Dec 14, 1976
Bought by
Craig Craig F and Craig Virginia B
Create a Home Valuation Report for This Property
The Home Valuation Report is an in-depth analysis detailing your home's value as well as a comparison with similar homes in the area
Home Values in the Area
Average Home Value in this Area
Purchase History
| Date | Buyer | Sale Price | Title Company |
|---|---|---|---|
| Kahler William | $131,000 | -- | |
| Garzonio Jason M | -- | -- | |
| Garzonio Jason M | $100,000 | -- | |
| Norton Roy D | $13,500 | -- | |
| Craig Craig F | -- | -- |
Source: Public Records
Mortgage History
| Date | Status | Borrower | Loan Amount |
|---|---|---|---|
| Open | Craig Craig F | $134,693 | |
| Previous Owner | Craig Craig F | $93,000 | |
| Previous Owner | Craig Craig F | $82,500 |
Source: Public Records
Tax History Compared to Growth
Tax History
| Year | Tax Paid | Tax Assessment Tax Assessment Total Assessment is a certain percentage of the fair market value that is determined by local assessors to be the total taxable value of land and additions on the property. | Land | Improvement |
|---|---|---|---|---|
| 2024 | $807 | $53,000 | $8,200 | $44,800 |
| 2023 | $807 | $53,000 | $8,200 | $44,800 |
| 2022 | $759 | $37,200 | $6,025 | $31,175 |
| 2021 | $759 | $37,200 | $6,025 | $31,175 |
| 2020 | $759 | $37,200 | $6,025 | $31,175 |
| 2019 | $747 | $30,850 | $4,625 | $26,225 |
| 2018 | $747 | $30,850 | $4,625 | $26,225 |
| 2017 | $747 | $30,850 | $4,625 | $26,225 |
| 2016 | $747 | $30,850 | $4,625 | $26,225 |
| 2015 | $746 | $30,850 | $4,625 | $26,225 |
| 2014 | $746 | $30,851 | $0 | $0 |
Source: Public Records
Map
Nearby Homes
- 0 Ray Bluff Rd
- 979 Ray Bluff Rd
- 0 Dixon Rd
- 119 Nancy Dr
- 9640 New Bethel Rd
- 400 Whippoorwill Cir
- 5391 Simmons Rd
- 9590 Monasco Rd
- 0 Monasco Rd Unit RTC2990463
- 9430 Monasco Rd
- 30 Kight Rd
- 0 Herring Hill Rd
- 8925 Herring Hill Rd
- 1461 Armstrong Rd
- 0 Chambers Rd
- TRACT 9 Powder Plant Dr
- 3300 Cuba Millington Rd
- 1932 Saint Paul Rd
- 8205 Shakerag Rd
- 0 St Paul Rd Unit 10199051