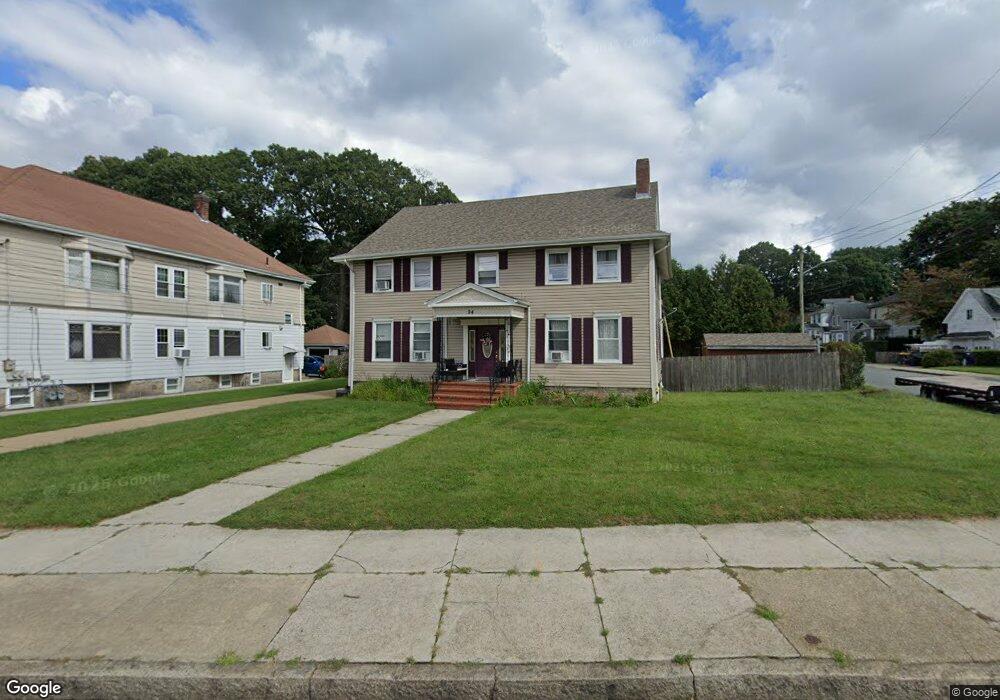
94 Eastern Ave Fall River, MA 02723
Flint NeighborhoodEstimated Value: $516,849 - $686,000
4
Beds
3
Baths
3,635
Sq Ft
$169/Sq Ft
Est. Value
About This Home
This home is located at 94 Eastern Ave, Fall River, MA 02723 and is currently estimated at $614,212, approximately $168 per square foot. 94 Eastern Ave is a home located in Bristol County with nearby schools including Mary Fonseca Elementary School, Talbot Innovation School, and B M C Durfee High School.
Ownership History
Date
Name
Owned For
Owner Type
Purchase Details
Closed on
Nov 24, 1998
Sold by
Camara Natalia M and Camara Horacio
Bought by
Oliveira Rui and Oliveira Rosario
Current Estimated Value
Purchase Details
Closed on
Aug 21, 1987
Sold by
Cardoso Fernando F
Bought by
Oliveira Jose
Home Financials for this Owner
Home Financials are based on the most recent Mortgage that was taken out on this home.
Original Mortgage
$110,000
Interest Rate
10.29%
Mortgage Type
Purchase Money Mortgage
Create a Home Valuation Report for This Property
The Home Valuation Report is an in-depth analysis detailing your home's value as well as a comparison with similar homes in the area
Home Values in the Area
Average Home Value in this Area
Purchase History
| Date | Buyer | Sale Price | Title Company |
|---|---|---|---|
| Oliveira Rui | $20,000 | -- | |
| Oliveira Jose | $150,000 | -- |
Source: Public Records
Mortgage History
| Date | Status | Borrower | Loan Amount |
|---|---|---|---|
| Previous Owner | Oliveira Jose | $94,500 | |
| Previous Owner | Oliveira Jose | $110,000 |
Source: Public Records
Tax History
| Year | Tax Paid | Tax Assessment Tax Assessment Total Assessment is a certain percentage of the fair market value that is determined by local assessors to be the total taxable value of land and additions on the property. | Land | Improvement |
|---|---|---|---|---|
| 2025 | $5,406 | $472,100 | $109,800 | $362,300 |
| 2024 | $4,929 | $429,000 | $105,700 | $323,300 |
| 2023 | $4,520 | $368,400 | $87,400 | $281,000 |
| 2022 | $4,178 | $331,100 | $83,200 | $247,900 |
| 2021 | $3,839 | $277,600 | $79,200 | $198,400 |
| 2020 | $3,429 | $237,300 | $78,000 | $159,300 |
| 2019 | $3,244 | $222,500 | $75,100 | $147,400 |
| 2018 | $2,985 | $204,200 | $81,400 | $122,800 |
| 2017 | $2,709 | $193,500 | $77,500 | $116,000 |
| 2016 | $2,666 | $195,600 | $82,500 | $113,100 |
| 2015 | $2,558 | $195,600 | $82,500 | $113,100 |
| 2014 | $2,558 | $203,300 | $80,100 | $123,200 |
Source: Public Records
Map
Nearby Homes
- 150 Downing St
- 165 Eastern Ave
- 580 County St
- 70 Jencks St
- 10 Carlisa Dr
- 88 Harrison St Unit 5
- 178 Thomas St
- 243 Oak Grove Ave
- 129 County St
- 1244 Pleasant St
- 756 County St
- 1155-1157 Pleasant St
- 84 Healy St
- 529 Eastern Ave
- 139 Quarry St
- 869 Bedford St
- 152 Alden St
- 25 Lebanon St Unit D
- 25 Lebanon St Unit C
- 168 Windsor St
Your Personal Tour Guide
Ask me questions while you tour the home.