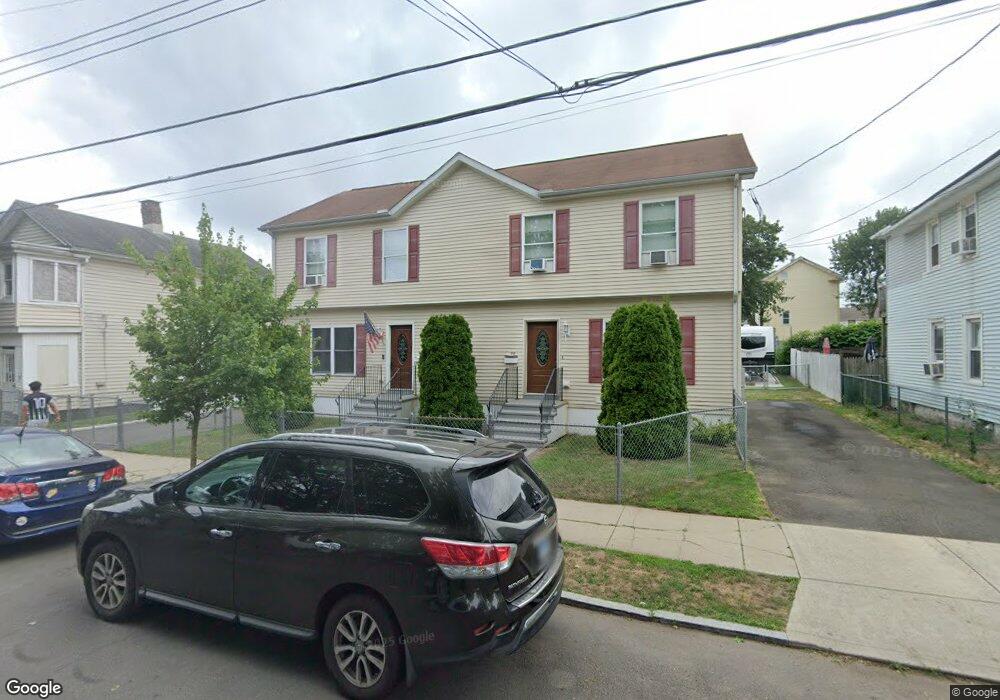
94 Fillmore St New Haven, CT 06513
Fair Haven NeighborhoodEstimated Value: $353,000 - $507,000
6
Beds
3
Baths
2,400
Sq Ft
$179/Sq Ft
Est. Value
About This Home
This home is located at 94 Fillmore St, New Haven, CT 06513 and is currently estimated at $429,069, approximately $178 per square foot. 94 Fillmore St is a home located in New Haven County with nearby schools including Clinton Avenue School, Elm City College Preparatory School, and St Francis & St Rose Of Lima School.
Ownership History
Date
Name
Owned For
Owner Type
Purchase Details
Closed on
Dec 7, 2004
Sold by
Corp Urban Homeownersh
Bought by
Betancourt Carlos S
Current Estimated Value
Home Financials for this Owner
Home Financials are based on the most recent Mortgage that was taken out on this home.
Original Mortgage
$143,000
Outstanding Balance
$71,424
Interest Rate
5.69%
Estimated Equity
$357,645
Create a Home Valuation Report for This Property
The Home Valuation Report is an in-depth analysis detailing your home's value as well as a comparison with similar homes in the area
Home Values in the Area
Average Home Value in this Area
Purchase History
| Date | Buyer | Sale Price | Title Company |
|---|---|---|---|
| Betancourt Carlos S | $173,000 | -- |
Source: Public Records
Mortgage History
| Date | Status | Borrower | Loan Amount |
|---|---|---|---|
| Open | Betancourt Carlos S | $143,000 |
Source: Public Records
Tax History Compared to Growth
Tax History
| Year | Tax Paid | Tax Assessment Tax Assessment Total Assessment is a certain percentage of the fair market value that is determined by local assessors to be the total taxable value of land and additions on the property. | Land | Improvement |
|---|---|---|---|---|
| 2025 | $8,564 | $217,350 | $54,810 | $162,540 |
| 2024 | $8,368 | $217,350 | $54,810 | $162,540 |
| 2023 | $8,085 | $217,350 | $54,810 | $162,540 |
| 2022 | $8,640 | $217,350 | $54,810 | $162,540 |
| 2021 | $5,925 | $135,030 | $42,140 | $92,890 |
| 2020 | $5,925 | $135,030 | $42,140 | $92,890 |
| 2019 | $5,804 | $135,030 | $42,140 | $92,890 |
| 2018 | $5,804 | $135,030 | $42,140 | $92,890 |
| 2017 | $5,223 | $135,030 | $42,140 | $92,890 |
| 2016 | $4,191 | $100,870 | $25,620 | $75,250 |
| 2015 | $4,191 | $100,870 | $25,620 | $75,250 |
| 2014 | $4,191 | $100,870 | $25,620 | $75,250 |
Source: Public Records
Map
Nearby Homes