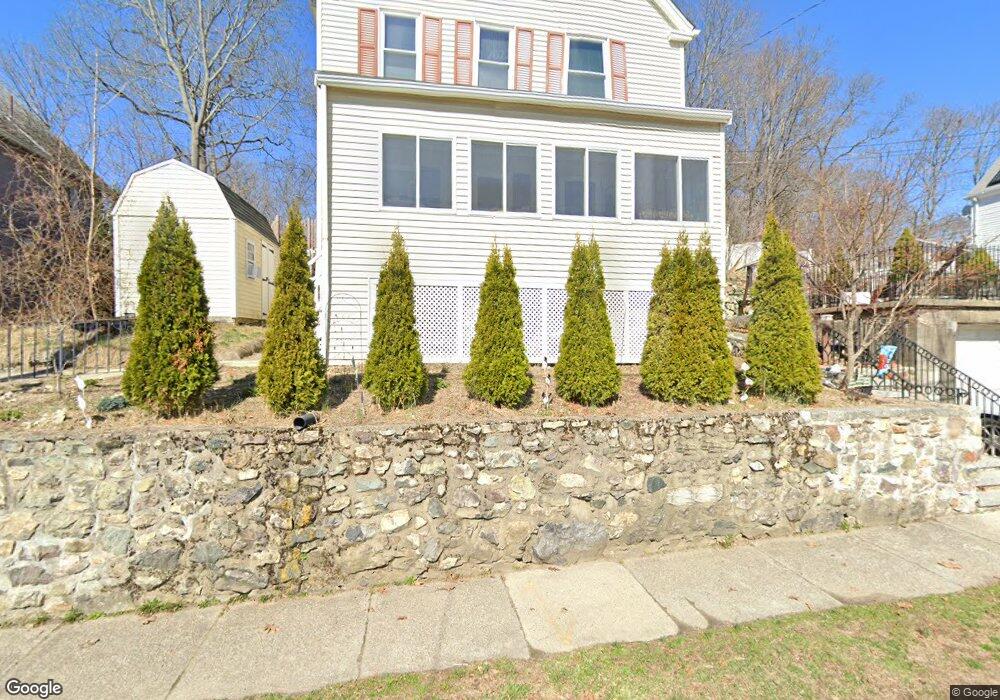
94 Forest St Melrose, MA 02176
Melrose East Side NeighborhoodEstimated Value: $717,000 - $843,167
3
Beds
2
Baths
1,452
Sq Ft
$540/Sq Ft
Est. Value
About This Home
This home is located at 94 Forest St, Melrose, MA 02176 and is currently estimated at $783,792, approximately $539 per square foot. 94 Forest St is a home located in Middlesex County with nearby schools including Hoover Elementary School, Lincoln Elementary School, and Winthrop Elementary School.
Ownership History
Date
Name
Owned For
Owner Type
Purchase Details
Closed on
Nov 17, 2011
Sold by
Cyr Angela M and Cyr Gregory B
Bought by
Novoa Cesar A and Prieto Guadalupe Ln
Current Estimated Value
Home Financials for this Owner
Home Financials are based on the most recent Mortgage that was taken out on this home.
Original Mortgage
$293,000
Outstanding Balance
$198,830
Interest Rate
3.92%
Mortgage Type
Purchase Money Mortgage
Estimated Equity
$584,962
Create a Home Valuation Report for This Property
The Home Valuation Report is an in-depth analysis detailing your home's value as well as a comparison with similar homes in the area
Home Values in the Area
Average Home Value in this Area
Purchase History
| Date | Buyer | Sale Price | Title Company |
|---|---|---|---|
| Novoa Cesar A | $293,000 | -- |
Source: Public Records
Mortgage History
| Date | Status | Borrower | Loan Amount |
|---|---|---|---|
| Open | Novoa Cesar A | $293,000 |
Source: Public Records
Tax History
| Year | Tax Paid | Tax Assessment Tax Assessment Total Assessment is a certain percentage of the fair market value that is determined by local assessors to be the total taxable value of land and additions on the property. | Land | Improvement |
|---|---|---|---|---|
| 2025 | $71 | $718,400 | $393,800 | $324,600 |
| 2024 | $6,811 | $685,900 | $368,400 | $317,500 |
| 2023 | $6,679 | $641,000 | $343,000 | $298,000 |
| 2022 | $6,529 | $617,700 | $330,300 | $287,400 |
| 2021 | $6,447 | $588,800 | $317,600 | $271,200 |
| 2020 | $6,227 | $563,500 | $292,200 | $271,300 |
| 2019 | $5,725 | $529,600 | $279,500 | $250,100 |
| 2018 | $4,931 | $435,200 | $231,800 | $203,400 |
| 2017 | $4,806 | $407,300 | $222,300 | $185,000 |
| 2016 | $4,126 | $334,600 | $196,900 | $137,700 |
| 2015 | $4,244 | $327,500 | $196,900 | $130,600 |
| 2014 | $4,138 | $311,600 | $181,000 | $130,600 |
Source: Public Records
Map
Nearby Homes
- 31 Temple St
- 0 S Mountain Avenue & O Cargil
- 65 Beacon St
- 7 Birch Hill Rd
- 20 Huntley St
- 30 Wheeler Ave
- 16 Willard St
- 48 Malvern St Unit 2
- 70 Sylvan St
- 124 Floral Ave
- 71-73 Grove St
- 58-60 Bainbridge St
- 1 Mill Rd
- 59 Dexter Rd
- 11 Havelock St
- 77 Lynde St
- 26 Webber St Unit 1
- 56 Rocky Nook Unit 56
- 311 Beech Ave
- 31 Preston St
Your Personal Tour Guide
Ask me questions while you tour the home.