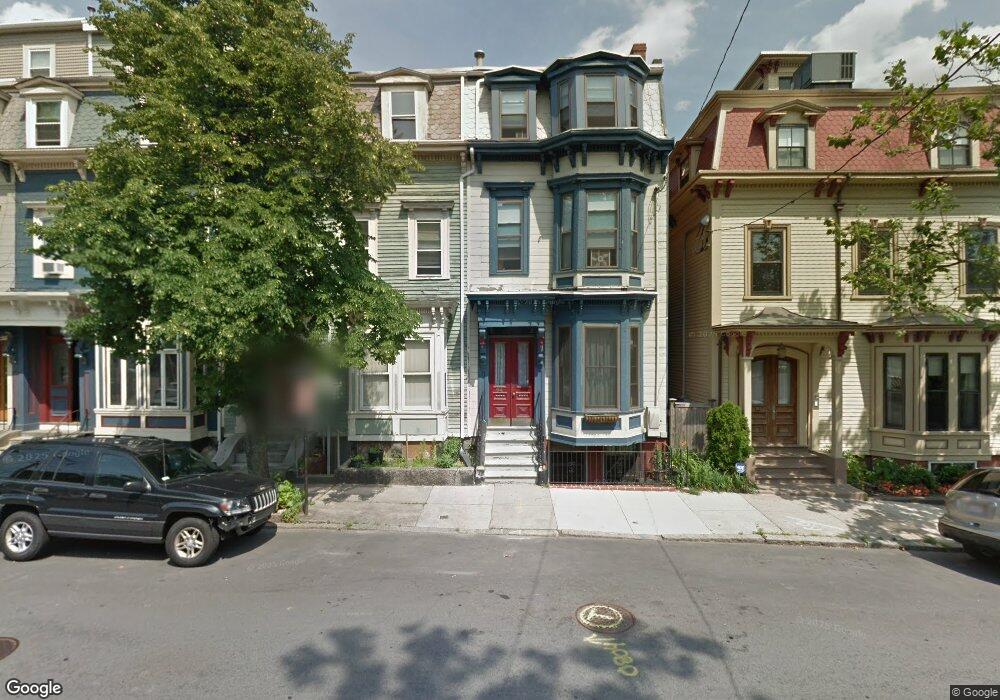
94 G St Unit 2 Boston, MA 02127
South Boston NeighborhoodEstimated Value: $551,910 - $725,000
2
Beds
1
Bath
912
Sq Ft
$708/Sq Ft
Est. Value
About This Home
This home is located at 94 G St Unit 2, Boston, MA 02127 and is currently estimated at $645,978, approximately $708 per square foot. 94 G St Unit 2 is a home located in Suffolk County with nearby schools including Up Academy Charter School Of Boston, Gate of Heaven Elementary School, and St Peter Academy.
Ownership History
Date
Name
Owned For
Owner Type
Purchase Details
Closed on
Aug 1, 2003
Sold by
Kealy Sean and Kealy Susan
Bought by
Peterson Karen K
Current Estimated Value
Home Financials for this Owner
Home Financials are based on the most recent Mortgage that was taken out on this home.
Original Mortgage
$296,875
Interest Rate
5.28%
Mortgage Type
Purchase Money Mortgage
Purchase Details
Closed on
Jul 2, 1997
Sold by
Regan Sean and Regan Jeanmarie
Bought by
Kealy Susan and Kealy Sean
Home Financials for this Owner
Home Financials are based on the most recent Mortgage that was taken out on this home.
Original Mortgage
$87,100
Interest Rate
7.86%
Mortgage Type
Purchase Money Mortgage
Purchase Details
Closed on
Jun 25, 1992
Sold by
Norris Maryanne O and Norris John R
Bought by
Regan Sean and Regan Jeanmarie
Home Financials for this Owner
Home Financials are based on the most recent Mortgage that was taken out on this home.
Original Mortgage
$105,200
Interest Rate
8.57%
Mortgage Type
Purchase Money Mortgage
Create a Home Valuation Report for This Property
The Home Valuation Report is an in-depth analysis detailing your home's value as well as a comparison with similar homes in the area
Home Values in the Area
Average Home Value in this Area
Purchase History
| Date | Buyer | Sale Price | Title Company |
|---|---|---|---|
| Peterson Karen K | $312,500 | -- | |
| Kealy Susan | $127,000 | -- | |
| Regan Sean | $117,000 | -- |
Source: Public Records
Mortgage History
| Date | Status | Borrower | Loan Amount |
|---|---|---|---|
| Open | Regan Sean | $292,500 | |
| Closed | Regan Sean | $296,875 | |
| Previous Owner | Regan Sean | $87,100 | |
| Previous Owner | Regan Sean | $105,200 |
Source: Public Records
Tax History
| Year | Tax Paid | Tax Assessment Tax Assessment Total Assessment is a certain percentage of the fair market value that is determined by local assessors to be the total taxable value of land and additions on the property. | Land | Improvement |
|---|---|---|---|---|
| 2025 | $5,407 | $466,900 | $0 | $466,900 |
| 2024 | $5,255 | $482,100 | $0 | $482,100 |
| 2023 | $5,073 | $472,300 | $0 | $472,300 |
| 2022 | $4,941 | $454,100 | $0 | $454,100 |
| 2021 | $4,750 | $445,200 | $0 | $445,200 |
| 2020 | $4,792 | $453,800 | $0 | $453,800 |
| 2019 | $4,472 | $424,300 | $0 | $424,300 |
| 2018 | $4,234 | $404,000 | $0 | $404,000 |
| 2017 | $3,999 | $377,600 | $0 | $377,600 |
| 2016 | $3,918 | $356,200 | $0 | $356,200 |
| 2015 | $4,182 | $345,300 | $0 | $345,300 |
| 2014 | $3,878 | $308,300 | $0 | $308,300 |
Source: Public Records
Map
Nearby Homes
- 427 E 6th St Unit 3
- 84 G St Unit 3
- 84 G St Unit PH
- 426 E 6th St Unit 1
- 35 Story St Unit 2
- 51-53 Story St Unit 1
- 19 Linden St
- 20 Winfield St Unit 3
- 13 Pacific St
- 2 Pacific St
- 587 E 4th St Unit 3
- 493 E 7th St
- 53 Thomas Park Unit 2
- 500 E 6th St
- 480 E 4th St Unit 3
- 511 E 8th St Unit 1
- 511 E 5th St Unit 3F
- 511 E 5th St Unit PH
- 511 E 5th St Unit 3R
- 511 E 5th St Unit 2R
Your Personal Tour Guide
Ask me questions while you tour the home.