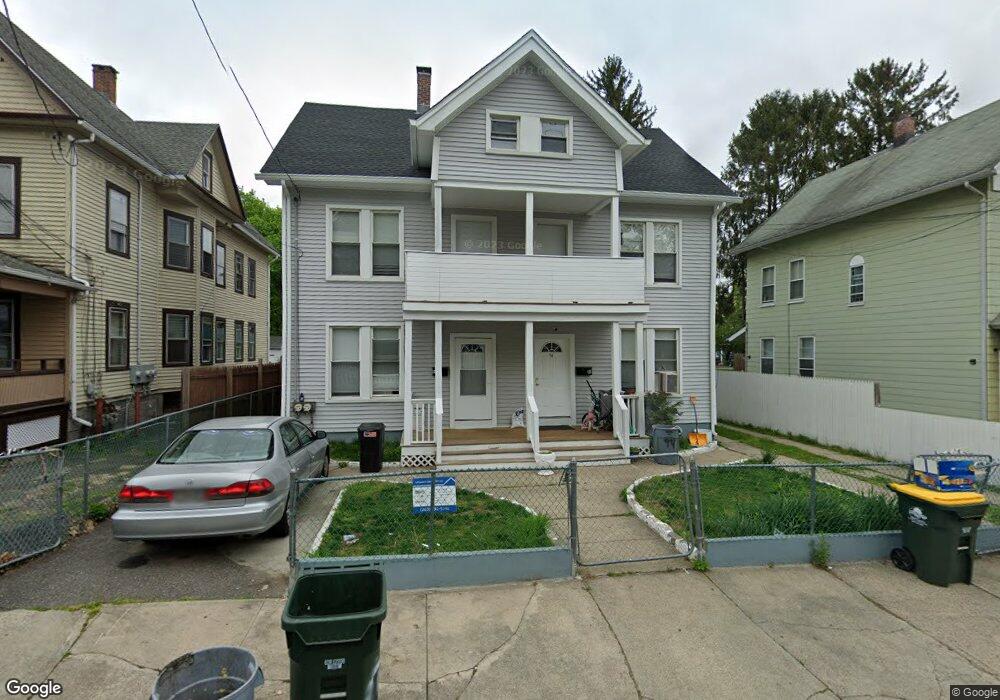
94 High St Ansonia, CT 06401
Estimated Value: $300,000 - $484,000
6
Beds
2
Baths
2,847
Sq Ft
$145/Sq Ft
Est. Value
About This Home
This home is located at 94 High St, Ansonia, CT 06401 and is currently estimated at $411,563, approximately $144 per square foot. 94 High St is a home located in New Haven County with nearby schools including Ansonia Middle School, Ansonia High School, and Assumption School.
Ownership History
Date
Name
Owned For
Owner Type
Purchase Details
Closed on
May 14, 2021
Sold by
Zhang Lin
Bought by
Mercy Painting & Gutters
Current Estimated Value
Home Financials for this Owner
Home Financials are based on the most recent Mortgage that was taken out on this home.
Original Mortgage
$140,000
Outstanding Balance
$125,791
Interest Rate
3.1%
Mortgage Type
Purchase Money Mortgage
Estimated Equity
$285,772
Purchase Details
Closed on
Jul 3, 2020
Sold by
Zhang Sheng
Bought by
Zhang Lin
Purchase Details
Closed on
Jan 19, 1996
Sold by
Collins John R and Collins George J
Bought by
Fisher Thomas J
Home Financials for this Owner
Home Financials are based on the most recent Mortgage that was taken out on this home.
Original Mortgage
$71,250
Interest Rate
7.16%
Mortgage Type
Unknown
Create a Home Valuation Report for This Property
The Home Valuation Report is an in-depth analysis detailing your home's value as well as a comparison with similar homes in the area
Home Values in the Area
Average Home Value in this Area
Purchase History
| Date | Buyer | Sale Price | Title Company |
|---|---|---|---|
| Mercy Painting & Gutters | $180,000 | None Available | |
| Zhang Lin | -- | None Available | |
| Fisher Thomas J | $75,000 | -- |
Source: Public Records
Mortgage History
| Date | Status | Borrower | Loan Amount |
|---|---|---|---|
| Open | Mercy Painting & Gutters | $140,000 | |
| Previous Owner | Fisher Thomas J | $60,000 | |
| Previous Owner | Fisher Thomas J | $71,250 |
Source: Public Records
Tax History
| Year | Tax Paid | Tax Assessment Tax Assessment Total Assessment is a certain percentage of the fair market value that is determined by local assessors to be the total taxable value of land and additions on the property. | Land | Improvement |
|---|---|---|---|---|
| 2025 | $6,935 | $242,900 | $33,600 | $209,300 |
| 2024 | $6,434 | $242,900 | $33,600 | $209,300 |
| 2023 | $6,374 | $242,900 | $33,600 | $209,300 |
| 2022 | $5,587 | $147,800 | $33,300 | $114,500 |
| 2021 | $4,487 | $118,700 | $33,300 | $85,400 |
| 2020 | $4,487 | $118,700 | $33,300 | $85,400 |
| 2019 | $4,487 | $118,700 | $33,300 | $85,400 |
| 2018 | $4,430 | $118,700 | $33,300 | $85,400 |
| 2017 | $3,758 | $100,700 | $35,300 | $65,400 |
| 2016 | $3,758 | $100,700 | $35,300 | $65,400 |
| 2015 | $3,778 | $100,700 | $35,300 | $65,400 |
| 2014 | $3,888 | $100,700 | $35,300 | $65,400 |
| 2013 | $3,962 | $100,700 | $35,300 | $65,400 |
Source: Public Records
Map
Nearby Homes
- 24 Lester St
- 16 Holbrook Ct
- 106 Howard Ave
- 185 Wakelee Ave
- 10 Clarkson St Unit 12
- 39 Bassett St
- 19 5th St
- 91 4th St Unit 7
- 222 1/2 N State St
- 257 N State St
- 45 Orchard St
- 7 Cook St
- 10 Ells St
- 93 Division St
- 91 Division St
- 22 Woodbridge Ave
- 226 Seymour Ave Unit 228
- 4 Fairview Terrace
- 4 N Spring St
- 84 Hodge Ave
Your Personal Tour Guide
Ask me questions while you tour the home.