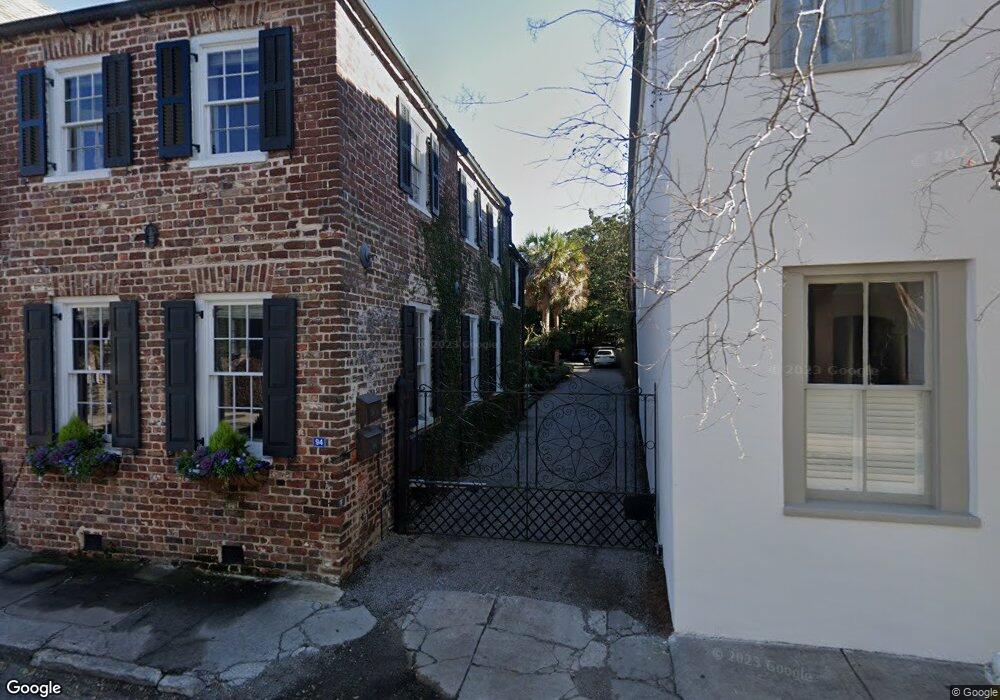
94 King St Unit D Charleston, SC 29401
South of Broad NeighborhoodEstimated Value: $1,502,896 - $1,887,000
2
Beds
2
Baths
1,480
Sq Ft
$1,132/Sq Ft
Est. Value
About This Home
This home is located at 94 King St Unit D, Charleston, SC 29401 and is currently estimated at $1,675,974, approximately $1,132 per square foot. 94 King St Unit D is a home located in Charleston County with nearby schools including Memminger Elementary School, Simmons Pinckney Middle, and Burke High School.
Ownership History
Date
Name
Owned For
Owner Type
Purchase Details
Closed on
Jul 25, 2018
Sold by
Hutchinson Stephen F
Bought by
Peretsman Samuel J and Peretsman Debora R
Current Estimated Value
Home Financials for this Owner
Home Financials are based on the most recent Mortgage that was taken out on this home.
Original Mortgage
$614,737
Outstanding Balance
$532,761
Interest Rate
4.5%
Mortgage Type
New Conventional
Estimated Equity
$1,143,213
Purchase Details
Closed on
Jul 9, 2007
Sold by
Hutchinson Kathleen L
Bought by
Hutchinson Stephen F
Purchase Details
Closed on
Apr 11, 2005
Sold by
Spence Wilbert B
Bought by
Hutchinson Stephen F and Hutchinson Kathleen L
Purchase Details
Closed on
Jun 2, 2004
Sold by
Dalziel Ian M and Dalziel Nadia
Bought by
Spence Wilbert B
Purchase Details
Closed on
Oct 24, 2000
Sold by
Koch Ruth M
Bought by
Dalziel Ian M and Dalziel Nadia
Create a Home Valuation Report for This Property
The Home Valuation Report is an in-depth analysis detailing your home's value as well as a comparison with similar homes in the area
Home Values in the Area
Average Home Value in this Area
Purchase History
| Date | Buyer | Sale Price | Title Company |
|---|---|---|---|
| Peretsman Samuel J | $945,750 | None Available | |
| Hutchinson Stephen F | -- | Attorney | |
| Hutchinson Stephen F | $1,125,000 | -- | |
| Spence Wilbert B | $850,000 | -- | |
| Dalziel Ian M | $609,000 | -- |
Source: Public Records
Mortgage History
| Date | Status | Borrower | Loan Amount |
|---|---|---|---|
| Open | Peretsman Samuel J | $614,737 |
Source: Public Records
Tax History Compared to Growth
Tax History
| Year | Tax Paid | Tax Assessment Tax Assessment Total Assessment is a certain percentage of the fair market value that is determined by local assessors to be the total taxable value of land and additions on the property. | Land | Improvement |
|---|---|---|---|---|
| 2024 | $19,204 | $60,900 | $0 | $0 |
| 2023 | $17,421 | $60,900 | $0 | $0 |
| 2022 | $16,181 | $60,900 | $0 | $0 |
| 2021 | $15,980 | $60,900 | $0 | $0 |
| 2020 | $15,862 | $60,900 | $0 | $0 |
| 2019 | $15,512 | $56,750 | $0 | $0 |
| 2017 | $4,109 | $33,980 | $0 | $0 |
| 2016 | $3,933 | $33,980 | $0 | $0 |
| 2015 | $4,069 | $33,980 | $0 | $0 |
| 2014 | $3,806 | $0 | $0 | $0 |
| 2011 | -- | $0 | $0 | $0 |
Source: Public Records
Map
Nearby Homes
- 12 Orange St
- 6 Orange St
- 69 King St
- 61 1/2 Tradd St
- 41 Legare St Unit B
- 125 Tradd St
- 103 Church St Unit A
- 67 Legare St Unit 307
- 125 Meeting St Unit C
- 143 Broad St
- 17 Water St
- 7 Logan St Unit F
- 146 Broad St Unit B
- 2 Bedons Aly
- 46 Queen St
- 21 Broad St
- 8 Elliott St
- 32 Church St
- 5 Legare St Unit C
- 5 Gadsdenboro St Unit 501