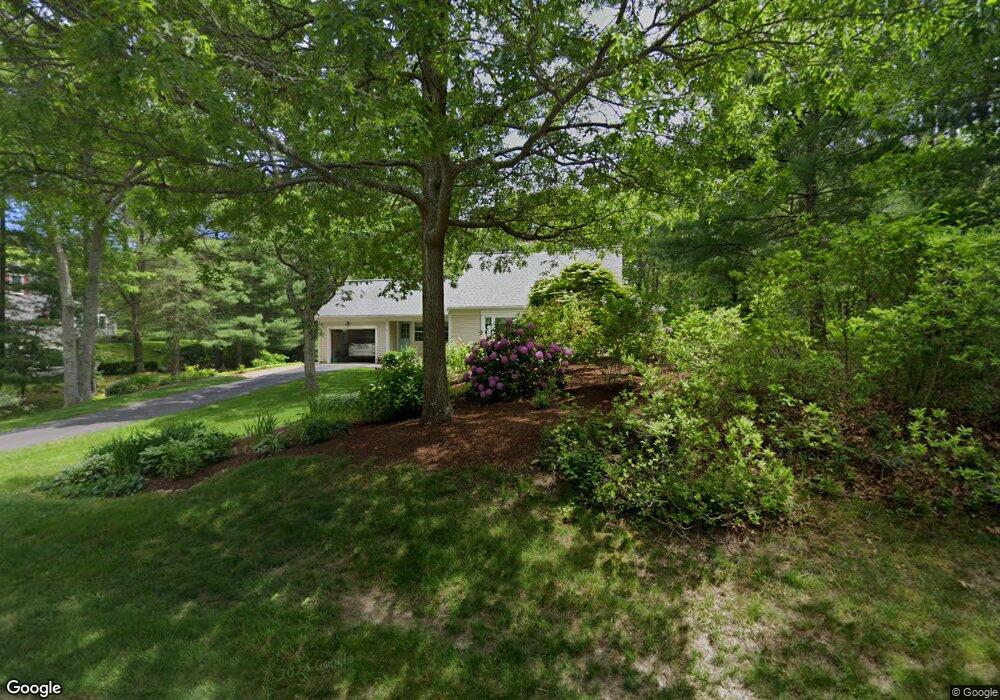
94 Marble Rd Barnstable, MA 02630
Barnstable Village NeighborhoodEstimated Value: $794,303 - $1,215,000
3
Beds
2
Baths
1,201
Sq Ft
$778/Sq Ft
Est. Value
About This Home
This home is located at 94 Marble Rd, Barnstable, MA 02630 and is currently estimated at $934,826, approximately $778 per square foot. 94 Marble Rd is a home located in Barnstable County with nearby schools including West Barnstable Elementary School, Barnstable United Elementary School, and Barnstable Intermediate School.
Ownership History
Date
Name
Owned For
Owner Type
Purchase Details
Closed on
Apr 14, 2000
Sold by
Buffum Richard S and Buffum Barbara E
Bought by
Moore Christopher H
Current Estimated Value
Home Financials for this Owner
Home Financials are based on the most recent Mortgage that was taken out on this home.
Original Mortgage
$180,000
Outstanding Balance
$61,800
Interest Rate
8.26%
Mortgage Type
Purchase Money Mortgage
Estimated Equity
$873,026
Create a Home Valuation Report for This Property
The Home Valuation Report is an in-depth analysis detailing your home's value as well as a comparison with similar homes in the area
Home Values in the Area
Average Home Value in this Area
Purchase History
| Date | Buyer | Sale Price | Title Company |
|---|---|---|---|
| Moore Christopher H | $200,000 | -- |
Source: Public Records
Mortgage History
| Date | Status | Borrower | Loan Amount |
|---|---|---|---|
| Open | Moore Christopher H | $180,000 |
Source: Public Records
Tax History
| Year | Tax Paid | Tax Assessment Tax Assessment Total Assessment is a certain percentage of the fair market value that is determined by local assessors to be the total taxable value of land and additions on the property. | Land | Improvement |
|---|---|---|---|---|
| 2025 | $6,714 | $726,600 | $242,800 | $483,800 |
| 2024 | $6,138 | $700,700 | $242,800 | $457,900 |
| 2023 | $5,631 | $627,100 | $220,700 | $406,400 |
| 2022 | $5,506 | $493,400 | $151,800 | $341,600 |
| 2021 | $5,260 | $449,200 | $154,100 | $295,100 |
| 2020 | $5,182 | $422,700 | $154,100 | $268,600 |
| 2019 | $4,915 | $402,200 | $163,500 | $238,700 |
| 2018 | $5,019 | $399,000 | $190,500 | $208,500 |
| 2017 | $4,861 | $388,900 | $190,500 | $198,400 |
| 2016 | $4,642 | $376,500 | $186,800 | $189,700 |
| 2015 | $4,163 | $343,800 | $152,200 | $191,600 |
Source: Public Records
Map
Nearby Homes
- 41 Dromoland Ln
- 79 Bayberry Ln
- 3528 Main St
- 30 Indian Trail
- 44 Iris Ln
- 0 Indian Trail
- 0 Phinneys Ln
- 14 Commerce Rd
- 65 Oakmont Rd
- 4390 Main St
- 210 Attucks Ln
- 230 Attucks Ln
- 81 Desert Sands Ln
- 93 Harris Meadow Ln
- 800 Bearses Way Unit 2SB
- 800 Bearses Way Unit 1
- 800 Bearses Way Unit 5NB
- 800 Bearses Way Unit 5NB
- 800 Bearses Way Unit 1NE
- 800 Bearses Way Unit 3NF
- 76 Marble Rd
- 91 Cobblestone Rd
- 79 Marble Rd
- 67 Cobblestone Rd
- 113 Marble Rd
- 117 Cobblestone Rd
- 103 Cobblestone Rd
- 58 Marble Rd
- 138 Marble Rd
- 105 Cobblestone Rd
- 0 Cobble Stone Rd
- 63 Marble Rd
- 139 Marble Rd
- 74 Cobblestone Rd
- 212 Salt Rock Rd
- 102 Cobblestone Rd
- 74 Cobble Stone Rd
- 194 Salt Rock Rd
- 146 Marble Rd
- 42 Marble Rd
Your Personal Tour Guide
Ask me questions while you tour the home.